To access this window: Select the Platform Power Analysis viewpoint and click the Power sub-tab in the result tab.
Use the Power window to:
- View the estimated energy consumed by each package component in millijoules (mJ).
- Review the average rate of energy consumption (mJ/sec) per package component.
- Analyze estimated power usage over time, in milliwatts (mW).
Note
Platform Power Analysis viewpoint is available as part of energy analysis. Collecting energy analysis with Intel® SoC Watch is available for target Android*, Windows*, or Linux* devices and provided only with the Intel System Studio. Import and viewing of the Intel SoC Watch results is supported with any version of the VTune Amplifier.
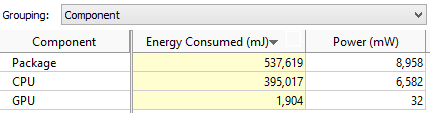
Power Pane
The Power Pane shows the amount of energy consumed by each component during collection (mJ and mW). The energy consumption is an estimate of the power consumed and not an exact measurement by the hardware. Consider running the same analysis on the device for a second time to have two sets of power metrics for data comparison.
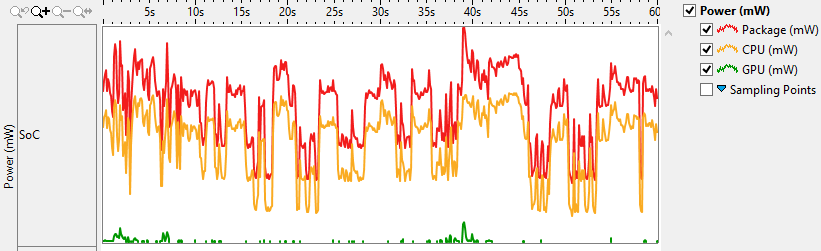
Timeline Pane
Use the toolbar at the top of the Timeline to zoom in/out on the view on areas of interest. Use the legend on the right to filter in/out any type of data presented on the timeline by selecting/deselecting check boxes. The blue sampling points indicate the point at which the sample was obtained from the hardware. The duration between sampling points is the sampling interval, which was specified during collection. Consider removing the sampling points when viewing the full timeline to see low energy metrics and adding them in after zooming in on a section of interest.
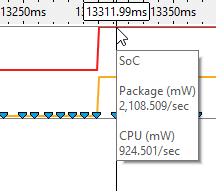
The example below shows the same timeline zoomed in to show only a few milliseconds of data to better display the individual sampling points. Hover over a blue marker to see the time when the sample was obtained.
Filters applied on a timeline in one window are applied on all other windows within the viewpoint. This is useful if you identify an issue on one tab and want to see how the issue impacts the metrics shown on a different tab. For more details on the Timeline control, see Managing Timeline View.