Use the Intel® Energy Profiler and Intel SoC Watch command line tool, available with the Intel® System Studio, to analyze power and energy consumption and identify system behaviors that waste energy on an Android*, Windows*, or Linux* OS system running on Intel architecture. Energy data collection is done using the Intel SoC Watch collector.
Energy Analysis with Intel Energy Profiler and Intel VTune Amplifier
You can use the VTune Amplifier as a viewer for the energy analysis by importing the collection results (*.sww1 for Windows OS /*.pwr for Android or Linux OS) into the VTune Amplifier GUI. The standalone, Intel System Studio, and Intel Parallel Studio versions of the VTune Amplifier all support the import of the Intel SoC Watch results.
This section provides an overview of what is needed to perform energy analysis on a target system running Windows, Linux, or Android OS and viewing the results with VTune Amplifier. Detailed instructions are available from Running Energy Analysis with Intel® VTune™ Amplifier.
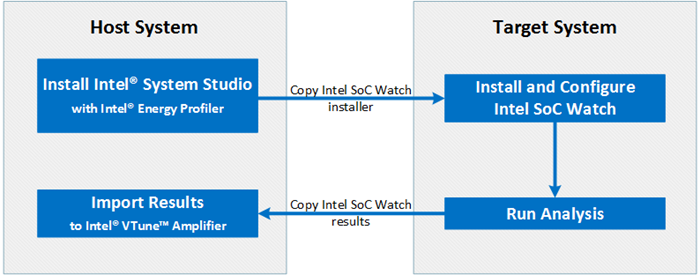
Install the appropriate version of Intel System Studio for your host and target system configuration. Be sure to include Intel Energy Profiler, which includes Intel SoC Watch and Intel VTune Amplifier, in your installed component products. The host system is the system on which Intel VTune Amplifier and Intel System Studio are installed. The target system is where Intel SoC Watch is run to collect energy metrics. In some cases, the host and target system may be the same.
If you are using a different host and target system, copy the collector package from the host system to the target system.
On the target system, install the collector and appropriate drivers for the target operating system. For more information, see:
On the target system, configure and run the data collection using Intel SoC Watch.
Data collection can occur on an idle system or run concurrently with a workload that is started at any time during the collection. For detailed descriptions of each feature and feature group, see the Getting Started or Quick Start sections of the Intel SoC Watch User's Guide (Linux and Android | Windows).
The result file is saved to the results directory with the following file extension:
- Windows* OS: *.sww1
- Android* or Linux* OS: *.sw2 and *.pwr
Copy the collection result file (*.sww1 on Windows or *.pwr on Linux or Android) from the target system to the host system.
Import the results to the VTune Amplifier project as follows:
Launch VTune Amplifier GUI on the host system.
Open/Create a project.
Click the
 Import Result button on the toolbar and browse to the result file.
The results are opened in the default Platform Power Analysis viewpoint.