To access this window: Select the Platform Power Analysis viewpoint and click the Wakelocks sub-tab in the result tab. The Wakelocks window is available for platform power analysis on Android* target systems only.
Use the Wakelocks window to:
- View lock duration and locking/unlocking reasons.
- Review kernel, or system, wakelocks and understand how they change over time.
- Understand which applications cause locks, the user locking process, and the user wakelock tag.
- Analyze user and application wakelock changes over time.
Note
Platform Power Analysis viewpoint is available as part of energy analysis. Collecting energy analysis with Intel® SoC Watch is available for target Android*, Windows*, or Linux* devices and provided only with the Intel System Studio. Import and viewing of the Intel SoC Watch results is supported with any version of the VTune Amplifier.
Wakelock Pane
The Wakelock pane shows the list of wakelock objects for the user/application or kernel, depending on the grouping selected. Change the grouping selection to view data about either kernel or application/user wakelocks and the process that caused the lock or unlock. The following grouping levels and combinations of these grouping levels are available from the Grouping drop-down menu:
- Kernel wakelock
- Locking processes
- Application name
- User locking process
- User wakelock tag
The grid displays the sample counts for each object. Click the
expand![]() /collapse
/collapse![]() buttons in the data columns to
expand the column and show data for different wakelock objects. By default, the
table is sorted by the
Kernel Wakelock/Locking Process/Locking Thread grouping in
ascending order, which provides the objects with the highest total lock
duration first. You can change the unit displayed by right-clicking a data cell
and selecting the
Show Data As option to select an alternate unit.
buttons in the data columns to
expand the column and show data for different wakelock objects. By default, the
table is sorted by the
Kernel Wakelock/Locking Process/Locking Thread grouping in
ascending order, which provides the objects with the highest total lock
duration first. You can change the unit displayed by right-clicking a data cell
and selecting the
Show Data As option to select an alternate unit.
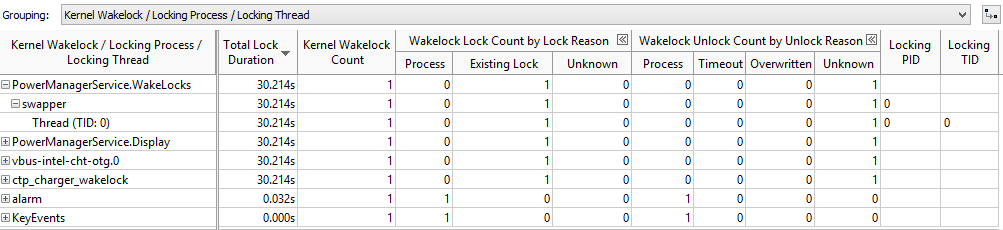
The following columns are available for kernel wakelocks.
Total Lock Duration |
Duration of the lock in seconds. |
Kernel Wakelock Count |
Number of kernel wakelocks that occurred. |
Wakelock Lock Count by Lock Reason |
Number of wakelocks for the following reasons: Process, Existing Lock, Unknown. An Existing Lock was already started when the collection began. |
Wakelock Unlock Count by Unlock Reason |
The number of wakelock unlocks for the following reasons: Process, Timeout, Overwritten, Unknown. An Unknown wakelock unlock reason may mean that the wakelock continued after the collection ended. |
Locking PID |
Identifier of the process that caused the wakelock lock. |
Locking TID |
Identifier of the thread that caused the wakelock lock. |
In the following example, the PowerManagerService.Wakelocks kernel wakelock had already started before the collection began and continued after the collection ended.
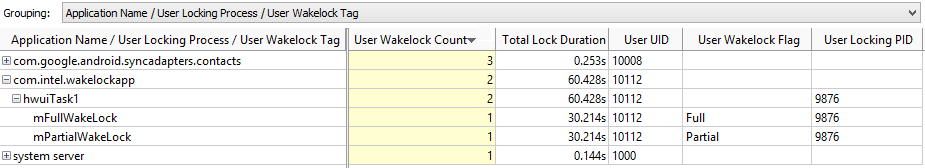
Application/user wakelocks show information for the APK name rather than the wakelock name like kernel wakelocks. The following columns are available for application/user wakelocks:
Total Lock Duration |
Duration of the lock in seconds. |
User Wakelock Count |
Number of user wakelocks that occurred. |
User Wakelock Flag |
The type of wakelock. |
User UID |
Identifier of the application that caused the wakelock lock or unlock. |
User Locking/Unlocking PID |
Identifier of the application that caused the wakelock lock or unlock. |
In the following example, two wakelocks originated from the com.intel.wakelockapp APK.
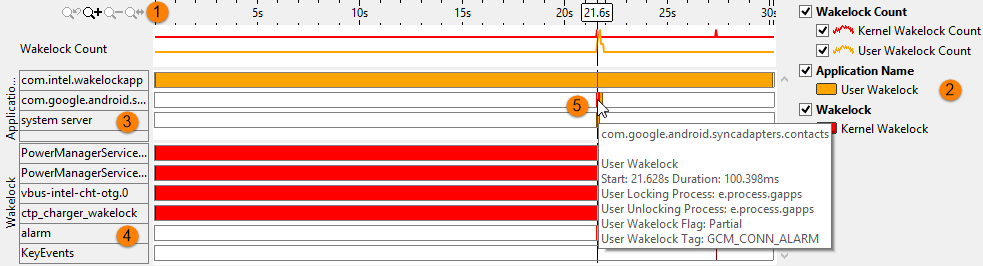
Timeline Pane
 |
Toolbar | Navigation control to zoom in/out on the view on areas of interest. For more details on the Timeline control, see Managing Timeline View. |
 |
Legend | Types of data presented on the timeline. Filter in/out any type of data presented on the timeline by selecting/deselecting corresponding check boxes. For example, you may only be interested in the application/user wakelock data and want to remove the kernel wakelock timelines for an expanded view of the application/user wakelock data. |
 |
Application Name | Graphical representation of the wakelock duration for each application APK. |
 |
Wakelock | Graphical representation of the kernel wakelock duration through the collection time. |
 |
Wakelock Details | Hover over the timeline of an application to view tooltips with details such as the wakelock type, start time, duration, locking and unlocking process name, and application name. Hover over the timeline of a kernel wakelock to view tooltips with details such as the wakelock type, start time, duration, locking and unlocking reasons, and locking process. Zoom in on the timeline to view the exact time when the wakelock started and when it was released. It is possible for one wakelock to begin before another ends, causing an overlap. 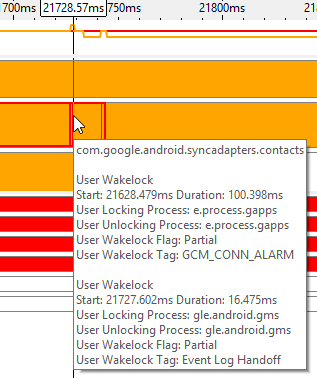 |
Filters applied on a timeline in one window are applied on all other windows within the viewpoint. This is useful if you identify an issue on one tab and want to see how the issue impacts the metrics shown on a different tab. For more details on the timeline control, see Managing Timeline View.