To access this window: Select the Platform Power Analysis viewpoint and click the Correlate Metrics sub-tab in the result tab.
Use the Correlate Metrics window to:
- Assess energy-related metrics across the platform.
- View timeline data aggregated from all tabs in the Platform Power Analysis viewpoint.
- Identify trends that impacted energy usage during the collection period.
Note
Platform Power Analysis viewpoint is available as part of energy analysis. Collecting energy analysis with Intel® SoC Watch is available for target Android*, Windows*, or Linux* devices and provided only with the Intel System Studio. Import and viewing of the Intel SoC Watch results is supported with any version of the VTune Amplifier.
The timelines in the Correlate Metrics window can also be found in other sub-tabs with the Platform Power Analysis result tab. The Correlate Metrics window is a good starting point if you are interested in identifying areas of energy inefficiency.
 |
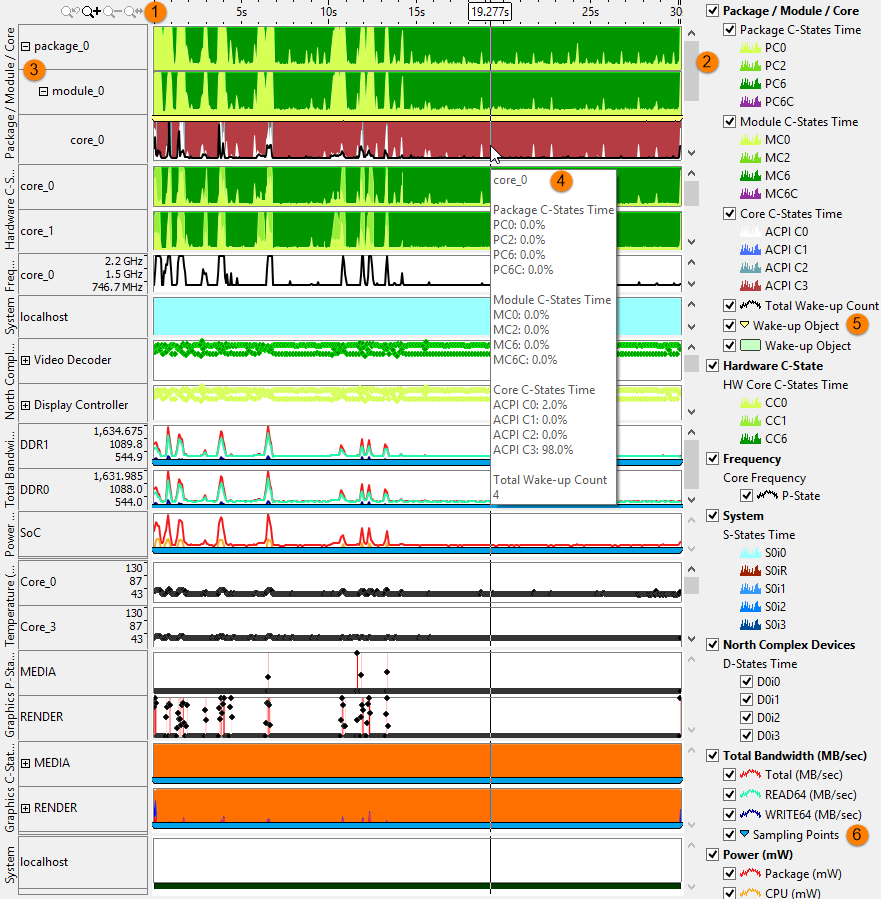
Toolbar | Navigation control to zoom in/out on the view on areas of interest. For more details on the Timeline control, see Managing Timeline View. |
 |
Legend | Types of data presented on the timeline. Filter in/out any type of data presented on the timeline by selecting/deselecting corresponding check boxes. For example, to remove the timeline for the North Complex Devices from the view, uncheck the North Complex Devices checkbox. |
 |
Expandable Rows | Click the
|
 |
Tooltips | Hover over the individual timelines to see data specific to that metric at that point during the collection. In the example, the C-States and Wake-up Counts for the Packages, Modules, and Cores are shown. |
 |
Wake-up Objects | Processor wake-ups on the timeline. Hover over a yellow marker to see the time when the sleep state change happened and the name of the wake-up object. Zoom in on the timeline to view individual wake-up markers. |
 |
Sampling Points | The point at which the sample was obtained from the hardware. The duration between sampling points is the sampling interval, which was specified during collection. Hover over a blue marker to see the time when the sample was obtained. Zoom in on the timeline to view individual sampling point markers and the time they occurred. |
 /
/ to expand the data and view
metrics for individual cores or devices.
to expand the data and view
metrics for individual cores or devices.
Examples
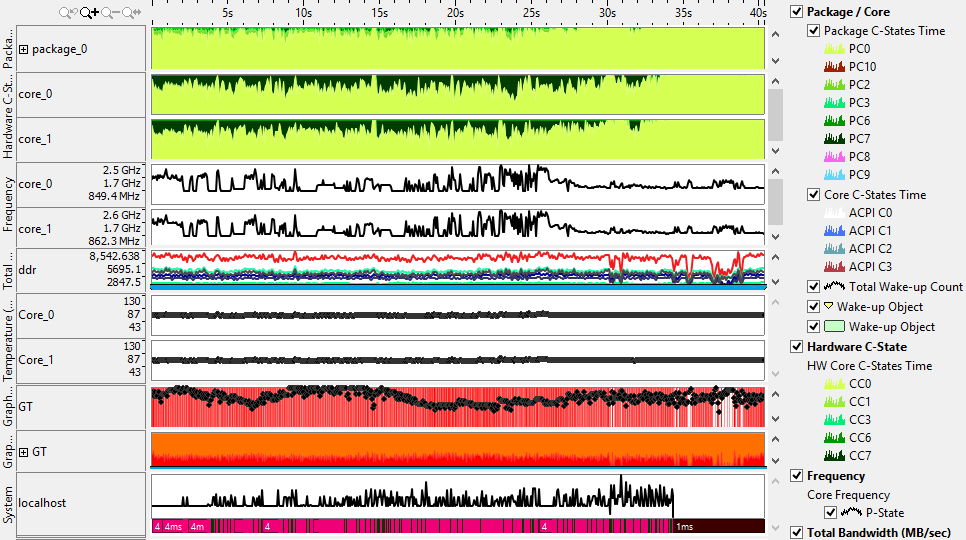
In the first example, the CPU starts in the active state and then drops into one of the deeper sleep states. The spikes in the CPU activity correspond to spikes in other timelines, such as the temperature and SoC power consumption. By viewing all data on one tab, you can identify trends and associations between metrics. To view each metric in more detail, visit the metric-specific tab.
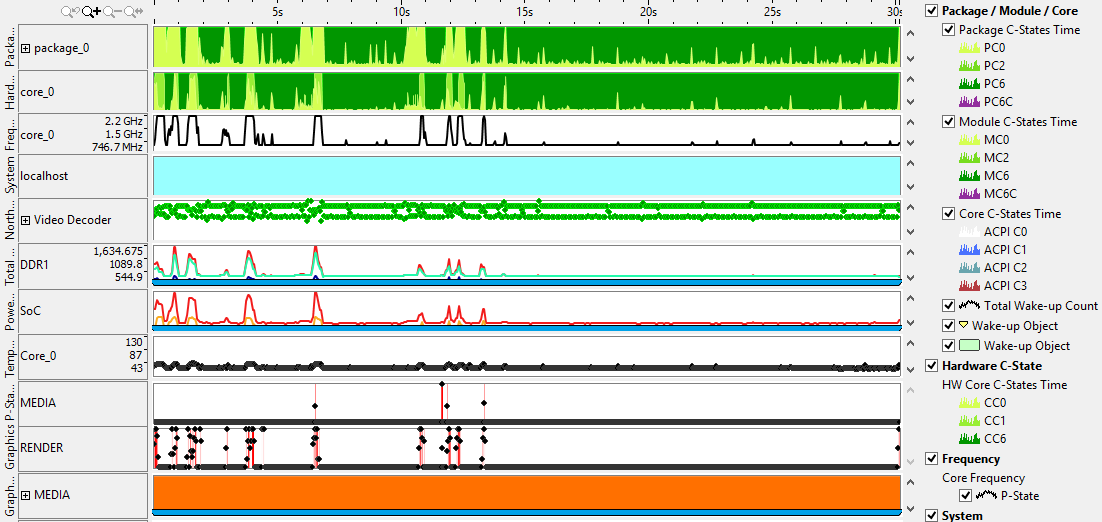
In the second example, the CPU spends most time in the active state, and the similar activity levels for the Core C-States and Frequency indicates balance in the distribution of that activity.