Use the Bottom-up window in the Hotspots or Hotspots by CPU Usage viewpoint to identify the most time-consuming functions and analyze their call flow at the bottom-level - from a function to its parent functions.
To access this window: Select the Hotspots or Hotspots by CPU Usage viewpoint and click the Bottom-up tab. Depending on the analysis type, the Bottom-up window may include the following panes:
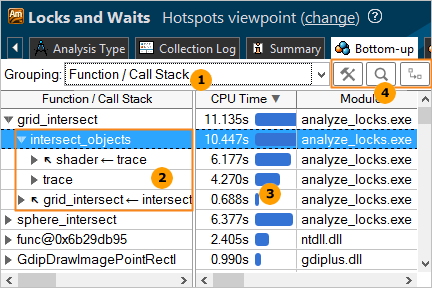
Bottom-up Pane
|
Grouping menu. Each row in the grid corresponds to a grouping level (granularity) of program units (module, function, synchronization object, and others). By default, the data in the Hotspots viewpoint is grouped by Function/Call Stack. |
|
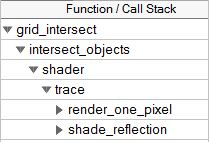
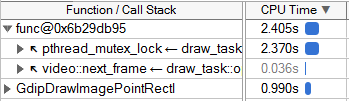
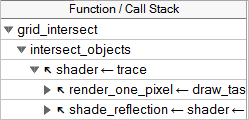
Call stack. Analyze a tree hierarchy of the call stacks that lead to the selected program unit. Click the triangle sign to expand a row and view caller trees for each program unit. Each tree is a call stack that called the selected unit. Each tree lists all the program units that had only one caller in the same row, with an arrow
The time value for a row is equal to the sum of all the nested items from that row. For example, the first caller of the hotspot grid_intersect function, intersect_objects, was called in two sequences. The time values for the nested items under intersect_objects equal the time value for this row: 6.177s +4.270s = 10.447s. Note
|
|
Performance metrics. Each data column in the grid corresponds to a performance metric. By default, all program units are sorted in the descending order by metric values in the fist column providing the most performance-critical program units first. You may click a column header to sort the table by the required metric. The list of performance metrics varies depending on the analysis type. Mouse over a column header (metric) to read the metric description and formula used for its calculation (if available), or right-click and select the What's This Column? option from the context menu. If a metric has a threshold value set up by the VTune Amplifier architect and this value is exceeded, the VTune Amplifier highlights such a value in pink. You may mouse over a pink cell to read the description of the detected issue, tuning advice, and view a formula used to calculate the threshold for this metric. For some analysis types, you may see grayed out metric values in the grid, which indicate that the data collected for such a metric is unreliable. This may happen, for example, if the number of samples collected for PMU events is too low. In this case, when you hover over such an unreliable metric value, the VTune Amplifier displays a message: The amount of collected PMU samples is too low to reliably calculate the metric. Depending on the analysis type and viewpoint, the Bottom-up view may represent the
CPU Time by utilization levels. Focus your tuning efforts on the program units with the largest
Poor value. This means that during the execution of these program units your application underutilized the CPU time. The overall goal of optimization is to achieve
Ideal (green
|
|
Toolbar. Select the following options to manage the Bottom-up view:
|


 Customize Grouping button to open the
 Find button to open a search bar and search for a string in the grid.
 Change Stack Layout button to switch between call stack layouts.
 are more natural for the top-down view: