Use this window for GPU analysis with Intel® VTune™ Amplifier to identify GPU tasks with high GPU utilization and estimate the effectiveness of this utilization. This view is particularly useful for analysis of OpenCL™ and Intel Media SDK applications doing substantial computation work on the GPU.
To access this window: Select the GPU Hotspots viewpoint and click the Graphics sub-tab in the result tab.
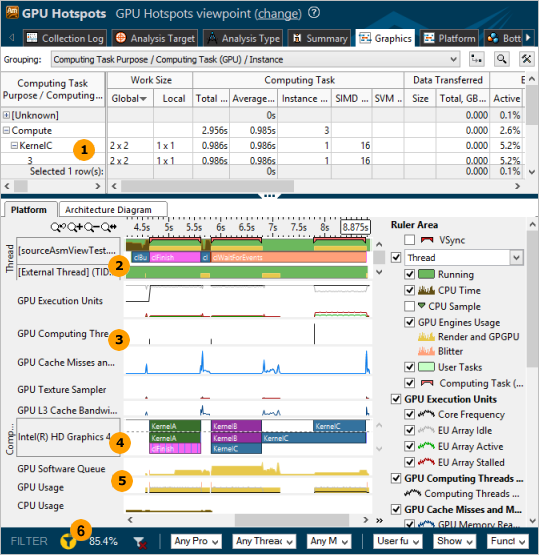
Along with the regular bottom-up analysis and stack data, the Graphics window correlates CPU / GPU busyness and displays the distribution of the GPU metrics over time:
|
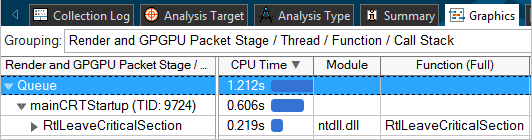
Grid. Analyze basic performance metrics per program unit and identify the most time-consuming units. If your application uses the OpenCL software technology and you ran the analysis with the Trace OpenCL and Intel Media SDK programs option enabled, the grid is grouped by Computing Task Purpose granularity by default. Analyze and optimize hot kernels with the longest Total Time values first. These include kernels characterized by long Average Time values and kernels whose Average Time values are not long, but they are invoked more frequently than the others (see Instance Count values). Both groups deserve attention. For more details, see Interpreting GPU OpenCL™ Application Analysis Data. To understand the CPU activity (which module/function was executed and its CPU time) while the GPU execution units were idle, queued, or busy executing some code, use the Render and GPGPU Packet Stage grouping level:
|
|
Thread. Explore CPU and GPU utilization by a particular thread. The Platform tab displays the thread name as a name of the module where the thread function resides. For example, if you have a myFoo function that belongs to MyMegaFoo (Linux*) or MyMegaFoo.dll (Windows*) function, the thread name is displayed as MyMegaFoo (Linux*) or MyMegaFoo.dll (Windows*) . This approach helps easily identify the location of the thread code producing the work displayed on the timeline. Windows* targets only: Correlate CPU and GPU usage and estimate whether your application is GPU bound. GPU Engines Usage bars show DMA packets on CPU threads originating GPU tasks. The bars are colored according to the type of used GPU engine (yellow bars in the example above correspond to the Render and GPGPU engine). |
|
GPU hardware metrics. If you enabled the Analyze Processor Graphics hardware events option for GPU analysis on the processors with the Intel® HD and Intel® Iris® Graphics, the VTune Amplifier displays the statistics for the selected group of metrics over time. For example, for the default Overview group of metrics, you may start with GPU Execution Units: EU Array Idle metric. Idle cycles are wasted cycles. No threads are scheduled and the EUs' precious computational resources are not being utilized. If EU Array Idle is zero, the GPU is reasonably loaded and all EUs have threads scheduled on them. In most cases the optimization strategy is to minimize the EU Array Stalled metric and maximize the EU Array Active. The exception is memory bandwidth-bound algorithms and workloads where optimization should strive to achieve a memory bandwidth close to the peak for the specific platform (rather than maximize EU Array Active). Memory accesses are the most frequent reason for stalls. The importance of memory layout and carefully designed memory accesses cannot be overestimated. If the EU Array Stalled metric value is non-zero and correlates with the GPU L3 Misses, and if the algorithm is not memory bandwidth-bound, you should try to optimize memory accesses and layout. Sampler accesses are expensive and can easily cause stalls. Sampler accesses are measured by the Sampler Is Bottleneck and Sampler Busy metrics. NoteFor Linux* targets, to analyze Intel Graphics hardware events on a GPU, make sure to install the Intel Media Server Studio (starting with version 2015 R5) and build the kernel driver as described in the Getting Started Guide. |
|
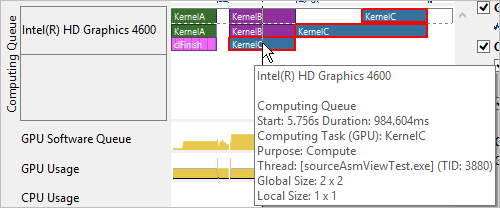
Computing Queue. Analyze details on OpenCL kernels submission, in particular distinguish the order of submission and execution, and identify the time spent in the queue, zoom in and explore the Computing Queue data. VTune Amplifier displays kernels with the same name and global/local size in the same color. Synchronization tasks are marked with vertical hatching
You can click a kernel task to highlight the whole queue to the execution displayed at the top layer. Hover over an object in the queue to see kernel execution parameters.
Windows targets only: Switch to the Platform window to explore how the execution path of the OpenCL device queue correlates to the DMA packets software queue. |
|
GPU Usage metrics. GPU usage bars are colored according to the type of used GPU engine. Theoretically, if the Platform tab shows that the GPU is busy most of the time and having small idle gaps between busy intervals and the GPU software queue is rarely decreased to zero, your application is GPU bound. If the gaps between busy intervals are big and the CPU is busy during these gaps, your application is CPU bound. But such obvious situations are rare and you need a detailed analysis to understand all dependencies. For example, an application may be mistakenly considered GPU bound when GPU engines usage is serialized (for example, when GPU engines responsible for video processing and for rendering are loaded in turns). In this case, an ineffective scheduling on the GPU results from the application code running on the CPU. |
|
Drag and drop to select an area of interest on the timeline and choose the
Filter In/Out by Selection from the context menu. The filtered out area is grayed out. The
filter toolbar shows the percentage of data currently displayed in the
Graphics view. Note that this value is based on the metric selected on the filter toolbar. To see the metric currently used for filtering, mouse over the
For the example above, 85.4% of the CPU Time metric (default metric base for the GPU Hotspots analysis) is shown with the selected range. When you filter the data in the Timeline pane, the grid is updated to display the statistics for your selection. |


 . Data transfers are marked with cross-diagonal hatching
 .
.


 Filter icon:

For further OpenCL kernel analysis, select a computing task you are interested in (for example, KernelC for the example above) and switch to the Architecture Diagram tab. VTune Amplifier displays performance data per GPU hardware metrics for the time range the selected kernel was executed:
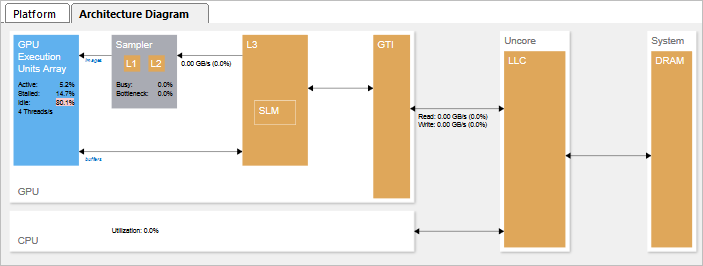
Values highlighted in pink signal a performance issue. In this example, 80% of the GPU time was spent idle when no threads were scheduled on a core. This is typically caused by imbalance or thread scheduling problems.