To access this window: Click the Platform sub-tab in the result tab.
Depending on the metrics collected during the analysis, use the Platform window to:
Inspect CPU and GPU utilization, frame rate and memory bandwidth.
Explore your application performance for user tasks such as Intel ITT API tasks, Ftrace*/Systrace* event tasks, OpenCL™ API tasks, and so on.
Correlate CPU and GPU activity and identify whether your application/some phases of it are GPU or CPU bound.
Analyze СPU/GPU interactions and software queue for GPU engines at each moment of time.
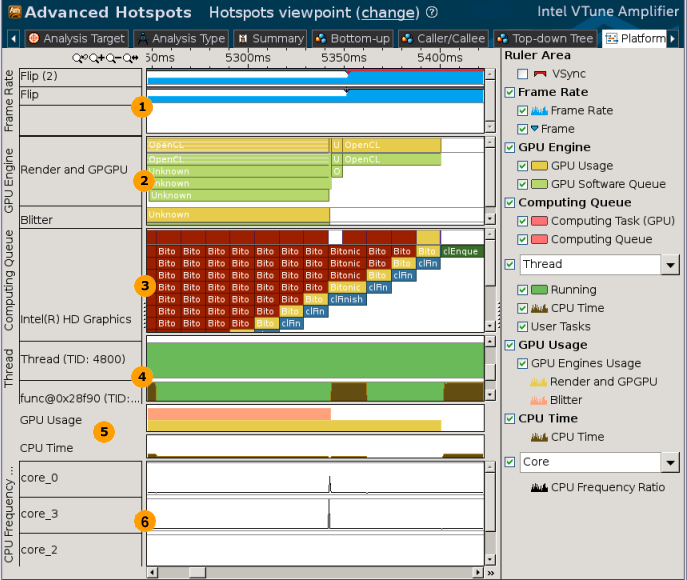
The Platform window represents a distribution of the performance data over time. For example, on Linux the Platform window displays the following data:
|
Frame Rate. Identify bounds for GPU and CPU frames (Windows only), where:
Hover over a frame object to view a summary including data on frame duration, frame rate, and others:
CPU and GPU frames with the same ID are displayed in the same color. NoteCPU Frames are displayed for results collected with the CPU/GPU Concurrency analysis on Windows systems only. For Android targets, only GPU Frames are available. |
|
GPU Engine. Explore overall GPU usage per GPU engine at each moment of time. By default, the Platform window displays GPU Usage and software queues per GPU engine. Hover over an object executed on the GPU (in yellow) to view a short summary on GPU usage, where GPU Usage is the time when a GPU engine was executing a workload. You can explore the top GPU Usage band in the chart to estimate the percentage of GPU engine utilization (yellow areas vs. white spaces) and options to submit additional work to the hardware. To view and analyze GPU software queues, select an object (packet) in the queue and the VTune Amplifier highlights the corresponding software queue bounds:
Full software queue prevents packet submissions and causes waits on a CPU side in the user-mode driver until there is space in the queue. To check whether such a stall decreases your performance, you may decrease a workload on the hardware and switch to the Graphics window to see if there are less waits on the CPU in threads that spawn packets. Another option could be to additionally load the queue by tasks and see whether the queue length increases. Each packet in the Platform window has its own ID that helps track its life cycle in a software queue. The ID does not correspond to the rendered frames. You may identify where a packet came from by the thread name (corresponding to the name of the module where a thread entry point resides) specified in the tooltip. Horizontal hatching is used for data that may be not accurate due to collection issues (for example, missing event from the Intel® Graphics Driver). This type of data is identified as Reconstructed packets in the Legend. Windows only: For Windows targets, you may select the Packet Type drop-down menu option in the Legend area to explore GPU usage and software queues per DMA packet domain:
Presents on Windows targets are displayed in a red hatch. |
|
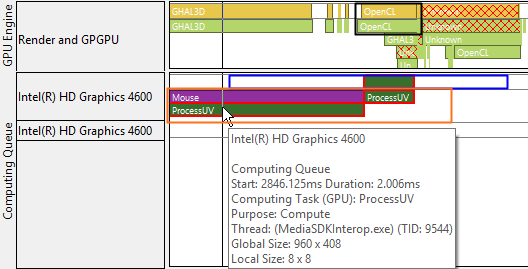
Computing Queue. Analyze details on OpenCL™ kernels submission, in particular distinguish the order of submission and execution, and identify the time spent in the queue, zoom in and explore the Computing Queue data. VTune Amplifier displays kernels with the same name and global/local size in the same color. On Windows, synchronization tasks are marked with vertical hatching
You can click a kernel task to highlight the whole queue to the execution displayed at the top layer. Hover over an object in the queue to see kernel execution parameters.
Windows only:
On Windows, you can explore how the execution path (marked in blue) of the OpenCL device queue (in orange) correlates with the DMA packets software queue (in black). The OpenCL kernel queue expedites kernels to the driver where DMA packets of different types are get multiplexed in the single DMA queue. In the example above, the Render and GPGPU queue serves both graphics (GHAL3D) and compute (OpenCL)-originated packets. |
|
Thread. Explore CPU utilization by thread. The Platform window displays the thread name as a name of the module where the thread function resides. For example, if you have a myFoo function that belongs to MyMegaFoo function, the thread name is displayed as MyMegaFoo. This approach helps easily identify the location of the thread code producing the work displayed on the timeline. If your code used the Task API to mark the tasks regions or you enabled any system tasks for monitoring specific events, the task objects show up on the timeline and you ca hover over such an object for details:
Windows only: Hover over a context switch area to see the details on its duration, reason, and affected CPU. Dark-green context switches show time slices when a thread was busy with a workload while light-green context switch objects show areas where a thread was waiting for a synchronization object. Gray areas show inactivity periods caused by preemption when the operating system task scheduler switched a thread off a processor to run another, higher-priority thread.
Correlate CPU and GPU usage and estimate whether your application is CPU or GPU bound. GPU Engines Usage bars show DMA packets on CPU threads originating GPU tasks. The bars are colored according to the type of used GPU engine (yellow bars in the example below correspond to the Render and GPGPU engine). If the GPU Engine area of the Platform window shows aggregated GPU usage for all threads and processes in the system, the GPU Engines Usage bars in the Thread area show GPU engine utilization by a particular thread. |
|
GPU Metrics. Correlate the data on GPU activity per GPU metrics with the CPU usage data. The GPU Usage bars are colored according to the type of used GPU engine. To analyze CPU and GPU usage per thread, switch to the Graphics window. NoteFor Linux* targets, to analyze Intel HD Graphics and Intel® Iris® Graphics hardware events on a GPU, make sure to install the Intel Media Server Studio (starting with version 2015 R5) and build the kernel driver as described in the Getting Started Guide. |
|
Core Frequency. Explore the ratio between the actual and the nominal CPU frequencies. Values above 1.0 indicate that CPU is operating in a turbo boost mode. NoteThis data is available only for the hardware event-based sampling analysis results. |
DRAM Bandwidth. Explore the application performance per Uncore to DRAM Bandwidth metrics over time. NoteThis data is available only for the hardware event-based sampling analysis results with the bandwidth events collection enabled. |
|
Interrupt. Identify the intervals where system interrupts occurred. Hover over an interrupt object to view full details in the tooltip:
NoteThis type of data shows up for the custom data collection results if you enabled the corresponding Ftrace events collection during the analysis type configuration. |
|
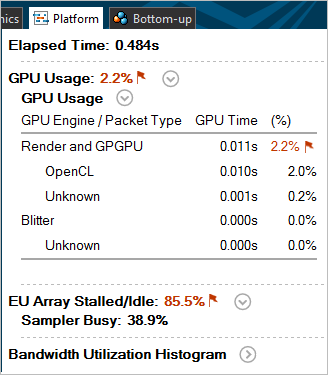
Explore the Context Summary provided to the right of the Timeline pane in the GPU Hotspots viewpoint. It displays the summary statistics for the context selected on the timeline. By default, the Context Summary shows data for the whole run. To narrow down the analysis, select an area of interest on the timeline, right-click and select Filter In by Selection.
The GPU Usage section shows the GPU Time per GPU engine and the percentage of the Elapsed Time executing on the GPU. The flagged GPU Usage value signals an ineffective utilization of the GPU resources, which is usually caused by imbalance or thread scheduling problems. |


 . Data transfers are marked with cross-diagonal hatching
 .
.


Note
To monitor general GPU usage over time on Windows OS, run the VTune Amplifier as an Administrator.