Use this window to analyze time regions where your application is CPU or GPU bound, identify high/low memory read/write bandwidth and estimate GPU activity on your system during the target execution.
To access this window: Select the Hotspots viewpoint and click the Graphics sub-tab in the result tab.
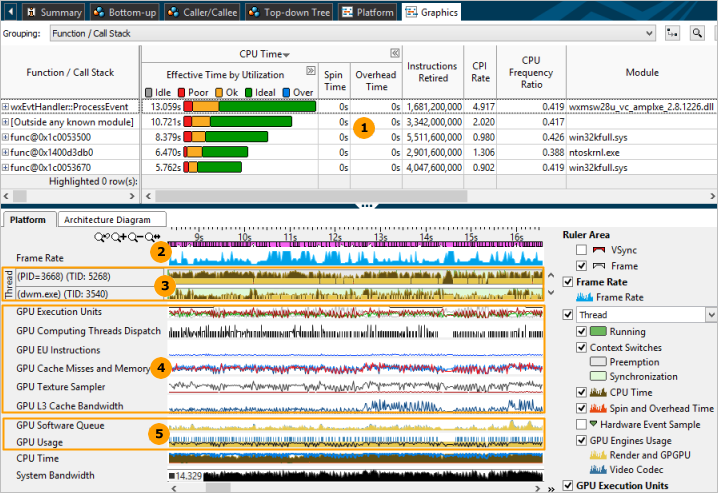
Along with the regular bottom-up analysis and stack data, the Graphics window correlates CPU / GPU busyness and displays the distribution of the GPU metrics over time:
|
Bottom-up grid. Analyze basic performance metrics per program unit (Function, by default) and identify the most time-consuming units. |
|
Frame Rate. Explore how the frame rate is changing over time. To understand the cause of the bottleneck, identify sections with the Slow or Fast frame types and analyze the GPU Usage. To identify a hotspot function containing the critical frame from the Timeline view, select the range with the Slow or Fast frame rate. VTune Amplifier highlights the selected frame in the Bottom-up grid. |
|
Thread. Explore CPU and GPU utilization by a particular thread. The Platform tab displays the thread name as a name of the module where the thread function resides. For example, if you have a myFoo function that belongs to MyMegaFoo (Linux*) or MyMegaFoo.dll (Windows*) function, the thread name is displayed as MyMegaFoo (Linux*) or MyMegaFoo.dll (Windows*) . This approach helps easily identify the location of the thread code producing the work displayed on the timeline. Hover over a context switch area to see the details on its duration, reason, and affected CPU. Dark-green context switches show time slices when a thread was busy with a workload while light-green context switch objects show areas where a thread was waiting for a synchronization object. Gray areas show inactivity periods caused by preemption when the operating system task scheduler switched a thread off a processor to run another, higher-priority thread. Windows* targets only: Correlate CPU and GPU usage and estimate whether your application is CPU or GPU bound. GPU Engines Usage bars show DMA packets on CPU threads originating GPU tasks. The bars are colored according to the type of used GPU engine (yellow bars in the example above correspond to the Render and GPGPU engine). |
|
GPU hardware metrics. If you enabled the Analyze Processor Graphics hardware events option for GPU analysis on the processors with the Intel® HD Graphics or Intel® Iris® Graphics, the VTune Amplifier displays the statistics for the selected group of metrics over time. For example, for the default Overview group of metrics, you may start with GPU Execution Units: EU Array Idle metric. Idle cycles are wasted cycles. No threads are scheduled and the EUs' precious computational resources are not being utilized. If EU Array Idle is zero, the GPU is reasonably loaded and all EUs have threads scheduled on them. In most cases the optimization strategy is to minimize the EU Array Stalled metric and maximize the EU Array Active. The exception is memory bandwidth-bound algorithms and workloads where optimization should strive to achieve a memory bandwidth close to the peak for the specific platform (rather than maximize EU Array Active). Memory accesses are the most frequent reason for stalls. The importance of memory layout and carefully designed memory accesses cannot be overestimated. If the EU Array Stalled metric value is non-zero and correlates with the GPU L3 Misses, and if the algorithm is not memory bandwidth-bound, you should try to optimize memory accesses and layout. Sampler accesses are expensive and can easily cause stalls. Sampler accesses are measured by the Sampler Is Bottleneck and Sampler Busy metrics. NoteTo analyze Intel® HD Graphics and Intel® Iris® Graphics hardware events on Linux targets, make sure to install the Intel Media Server Studio (starting with version 2015 R5) and build the kernel driver as described in the Intel Media Server Studio Getting Started Guide. |
|
GPU Usage metrics. GPU usage bars are colored according to the type of used GPU engine. Theoretically, if the Platform tab shows that the GPU is busy most of the time and having small idle gaps between busy intervals and the GPU software queue is rarely decreased to zero, your application is GPU bound. If the gaps between busy intervals are big and the CPU is busy during these gaps, your application is CPU bound. But such obvious situations are rare and you need a detailed analysis to understand all dependencies. For example, an application may be mistakenly considered GPU bound when GPU engines usage is serialized (for example, when GPU engines responsible for video processing and for rendering are loaded in turns). In this case, an ineffective scheduling on the GPU results from the application code running on the CPU. |


