Use the Summary window as your starting point of the performance analysis with the Intel® VTune™ Amplifier. To access this window, click the Summary sub-tab in the result tab.
The VTune Amplifier may analyze a metric, compare its value with the threshold value provided by Intel architects, and highlight the metric value in pink as a performance issue for an application as a whole. The issue description for such a value may be provided below the critical metric or when you hover over the highlighted metric.
The Summary window provides the following application-level statistics in the HPC Performance Characterizationviewpoint:
Note
You may click the
 Copy to Clipboard button to copy the content of the selected summary section to the clipboard.
Analysis Metrics
The
Summary window displays metrics that help you estimate an overall application execution. For a metric description, hover over the corresponding question mark icon
 to read the pop-up help.
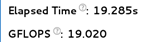
Use the Elapsed Time, GFLOPS, or GFLOPS Upper Bound (Intel® Xeon Phi™ processor only) metric as your primary indicator and a baseline for comparison of results before and after optimization.
CPU Utilization
The CPU Utilization section displays metrics for CPU usage during the collection time.
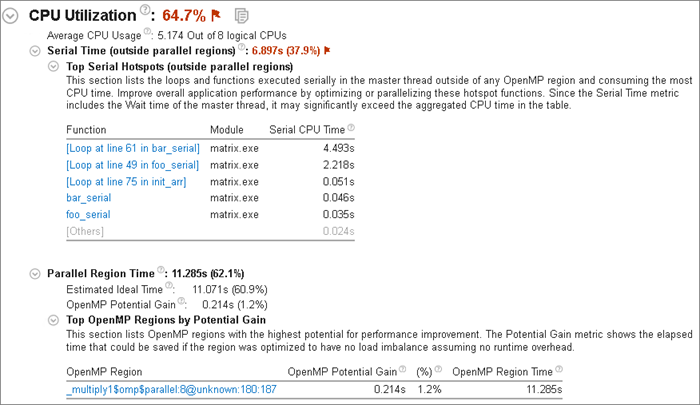
Metrics can include:
OpenMP Analysis Collection Time: Displays metrics for the duration of serial (outside of any parallel region) and parallel portions of the program. If the Serial time is significant, review the Top Serial Hotspots section and consider options to minimize serial execution, either by introducing more parallelism or by doing algorithm or microarchitecture tuning for sections that seem unavoidably serial. For high thread-count machines, serial sections have a severe negative impact on potential scaling (Amdahl's Law) and should be minimized as much as possible.
Top OpenMP Regions by Potential Gain: Displays the efficiency of Intel OpenMP* parallelization in the parallel part of the code and checks for an MPI imbalance. The Potential Gain metric estimates the elapsed time between the actual measurement and an idealized execution of parallel regions, assuming perfectly balanced threads and zero overhead of the OpenMP runtime on work arrangement. Use this data to understand the maximum time that you may save by improving parallel execution. If Potential Gain for a region is significant, you can go deeper and select the link on a region name to navigate to the Bottom-up window employing an OpenMP Region dominant grouping and the region of interest selection.
CPU Usage Histogram: Graphical representation of the percentage of wall time the specific number of CPUs the application was running simultaneously. The CPU usage does not contain spin and overhead time that does not perform actual work. Hover over a vertical bar to identify the amount of Elapsed Time the application spent using the specified number of logical CPU cores. Use the Average CPU Usage number as a baseline for your performance measurements. The closer this number to the number of logical CPU cores, the better. The CPU usage at any point cannot surpass the available number of logical CPU cores.
Memory Bound
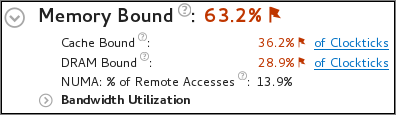
A high Memory Bound value might indicate that a significant portion of execution time was lost while fetching data. The section shows a fraction of cycles that were lost in stalls being served in different cache hierarchy levels (L1, L2, L3) or fetching data from DRAM. For last level cache misses that lead to DRAM, it is important to distinguish if the stalls were because of a memory bandwidth limit since they can require specific optimization techniques when compared to latency bound stalls. VTune Amplifier shows a hint about identifying this issue in the DRAM Bound metric issue description. This section also offers the percentage of accesses to a remote socket compared to a local socket to see if memory stalls can be connected with NUMA issues.
For Intel® Xeon Phi™ processors formerly code named Knights Landing, there is no way to measure memory stalls to assess memory access efficiency in general. Therefore Back-end Bound stalls that include memory-related stalls as a high-level characterization metric are shown instead. The second level metrics are focused particularly on memory access efficiency.
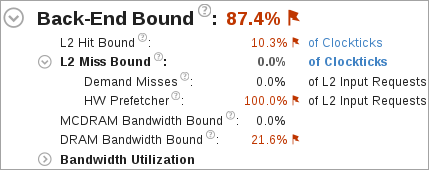
A high L2 Hit Bound or L2 Miss Bound value indicates that a high ratio of cycles were spent handing L2 hits or misses.
The L2 Miss Bound metric does not take into account data brought into the L2 cache by the hardware prefetcher. However, in some cases the hardware prefetcher can generate significant DRAM/MCDRAM traffic and saturate the bandwidth. The Demand Misses and HW Prefetcher metrics show the percentages of all L2 cache input requests that are caused by demand loads or the hardware prefetcher.
A high DRAM Bandwidth Bound or MCDRAM Bandwidth Bound value indicates that a large percentage of the overall elapsed time was spent with high bandwidth utilization. A high DRAM Bandwidth Bound value is an opportunity to run the Memory Access analysis to identify data structures that can be allocated in high bandwidth memory (MCDRAM), if it is available.
The Bandwidth Utilization Histogram shows how much time the system bandwidth was utilized by a certain value (Bandwidth Domain) and provides thresholds to categorize bandwidth utilization as High, Medium and Low. The thresholds are calculated based on benchmarks that calculate the maximum value. You can also set the threshold by moving the sliders at the bottom of the histogram. The modified values are applied to all subsequent results in the project.
If your application is memory bound, consider running a Memory Access analysis to identify deeper memory issues and examine memory objects in more detail.
FPU Utilization
Note
FPU and GFLOPS metrics are supported on 3rd Generation Intel Core™ processors, 5th Generation Intel processors, and 6th Generation Intel processors. Limited support is available for Intel® Xeon Phi™ processors formerly code named Knights Landing. The metrics are not currently available on 4th Generation Intel processors. Expand the Details section on the analysis configuration pane to view the processor family available on your system.
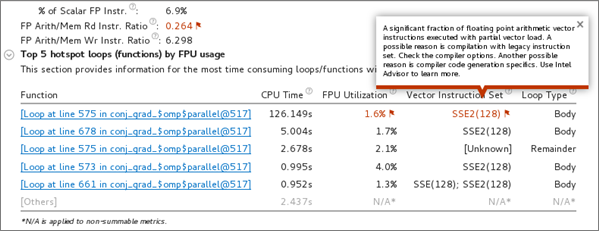
This metric shows how efficiently the application is using floating point units for vectorization. Expand the GFLOPS or GFLOPS Upper Bound (Intel Xeon Phi processors only) section to show the number of Scalar and Packed GFLOPS. This section provides a quick estimate of the amount of FLOPs that were not vectorized.
The Top Loops/Functions with FPU Usage by CPU Time table shows the top functions that contain floating point operations broken down by CPU usage. The FPU Utilization column provides issue descriptions based on whether a loop/function is bandwidth bound, vector instruction set, scalar, or vector and will provide direction on fixing memory bandwidth, changing the vector instruction set, or using Intel Advisor to eliminate the problems. For example, if a floating point loop (function) is bandwidth bound, use the Memory Access analysis to resolve the bandwidth bound issue. If a floating point loop is vectorized, use the Intel Advisor to improve the vectorization. If the loop is also bandwidth bound, the bandwidth bound issue should be resolved prior to improving vectorization. Click one of the function names to switch to the Bottom-up window and evaluate if the function is memory bound.
Collection and Platform Info
This section provides the following data:
Application Command Line |
Path to the target application. |
Operating System |
Operating system used for the collection. |
Computer Name |
Name of the computer used for the collection. |
Result Size |
Size of the result collected by the VTune Amplifier. |
Collection start time |
Start time (in UTC format) of the external collection. Explore the Timeline pane to track the performance statistics provided by the custom collector over time. |
Collection stop time |
Stop time (in UTC format) of the external collection. Explore the Timeline pane to track the performance statistics provided by the custom collector over time. |
CPU Information |
|
Name |
Name of the processor used for the collection. |
Frequency |
Frequency of the processor used for the collection. |
Logical CPU Count |
Logical CPU core count for the machine used for the collection. |
Physical Core Count |
Number of physical cores on the system. |
User Name |
User launching the data collection. This field is available if you enabled the per-user event-based sampling collection mode during the product installation. |