Use the Summary window as your starting point of the performance analysis with the Intel® VTune™ Amplifier. To access this window, click the Summary sub-tab in the result tab.
Depending on the analysis type, the Summary window provides the following application-level statistics in the Hotspots viewpoint:
Note
You may click the
 Copy to Clipboard button to copy the content of the selected summary section to the clipboard.
Analysis Metrics
The
Summary window displays a list of
CPU metrics that help you estimate an overall application execution. For a metric description, hover over the corresponding question mark icon
 to read the pop-up help:
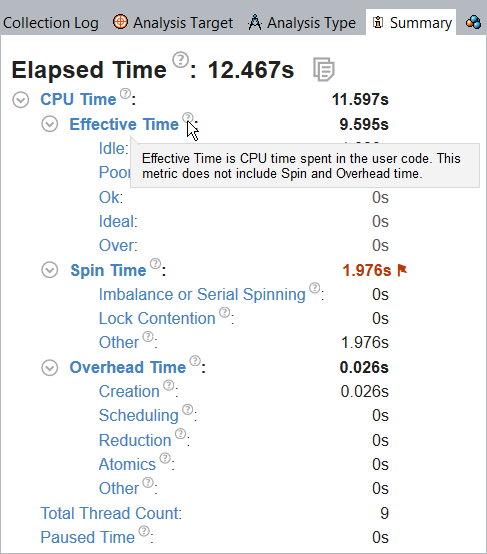
Use the Elapsed Time metric as your primary indicator and a baseline for comparison of results before and after optimization. Note that for multithreaded applications, the CPU Time is different from the Elapsed Time since the CPU Time is the sum of CPU time for all application threads.
For some analysis types, the Effective CPU Time is classified per CPU utilization as follows:
Utilization Type |
Description |
|---|---|
Idle |
Idle usage. By default, if the CPU Time is insignificant (less than 50% of 1 CPU), such CPU usage is classified as idle. |
Poor |
Poor usage. By default, poor usage is when the number of simultaneously running CPUs is less than or equal to 50% of the target CPU usage. |
OK |
Acceptable (OK) usage. By default, OK usage is when the number of simultaneously running CPUs is between 51-85% of the target CPU usage. |
Ideal |
Ideal usage. By default, Ideal usage is when the number of simultaneously running CPUs is between 86-100% of the target CPU usage. |
The Overhead and Spin Time metrics, if provided (depend on the analysis), can tell you how your application's use of synchronization and threading libraries is impacting the CPU time. Review the metrics within these categories to learn where your application might be spending additional time making calls to synchronization and threading libraries such as system synchronization API, Intel TBB, and OpenMP*. VTune Amplifier provides the following types of inefficiencies in your code taking CPU time:
Imbalance or Serial Spinning Time |
Imbalance or Serial Spinning time is CPU time when working threads are spinning on a synchronization barrier consuming CPU resources. This can be caused by load imbalance, insufficient concurrency for all working threads or waits on a barrier in the case of serialized execution. |
Lock Contention Spin Time |
Lock Contention time is CPU time when working threads are spinning on a lock consuming CPU resources. High metric value may signal inefficient parallelization with highly contended synchronization objects. To avoid intensive synchronization, consider using reduction, atomic operations or thread local variables where possible. |
Other Spin Time |
This metric shows unclassified Spin time spent in a threading runtime library. |
Creation Overhead Time |
Creation time is CPU time that a runtime library spends on organizing parallel work. |
Scheduling Overhead Time |
Scheduling time is CPU time that a runtime library spends on work assignment for threads. If the time is significant, consider using coarse-grain work chunking. |
Reduction Overhead Time |
Reduction time is CPU time that a runtime library spends on loop or region reduction operations. |
Atomics Overhead Time |
Atomics time is CPU time that a runtime library spends on atomic operations. |
Other Overhead Time |
This metric shows unclassified Overhead time spent in a threading runtime library. |
Depending on the analysis type, the VTune Amplifier may analyze a metric, compare its value with the threshold value provided by Intel architects, and highlight the metric value in pink as a performance issue for an application as a whole. The issue description for such a value may be provided below the critical metric or when you hover over the highlighted metric.
Each metric in the list shows up as a hyperlink. Clicking a hyperlink opens the Bottom-up window and sorts the grid by the selected metric or highlights the selected object in the grid.
Top Hotspots
VTune Amplifier displays the most performance-critical functions and their CPU Time in the Top Hotspots section. Optimizing these functions typically results in improving overall application performance. Clicking a function in the list opens the Bottom-up window with this function selected.
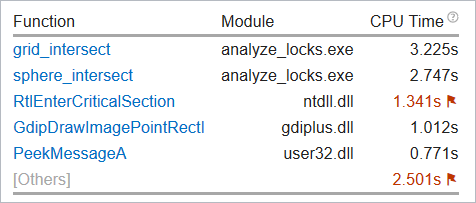
The grayed-out [Others] module, if provided, displays the total value for all other functions in the application that are not included into this table.
Note
You can control the number of objects in this list and displayed metrics via the viewpoint configuration file.
Top Tasks
This section provides a list of tasks that took most of the time to execute, where tasks are either code regions marked with Task API, or system tasks enabled to monitor Ftrace* events, Atrace* events, Intel Media SDK programs, OpenCL™ kernels, and so on.
Clicking a task type in the table opens the grid view (for example, Bottom-up or Event Count) grouped by the Task Type granularity. See Task Analysis for more information.
Average Bandwidth
This sections shows total memory bandwidth, Read Bandwidth, and Write Bandwidth per package averaged over the whole profiling session. This data is available if you run an analysis type collecting platform-wide metrics, for example, CPU/GPU Concurrency.
The performance of your application may be limited by memory bandwidth if values in this table are close to maximum possible bandwidth on your platform. You can use benchmarks to measure your platform maximum bandwidth, for example: Intel Memory Latency Checker.
CPU Usage Histogram
Explore the CPU Usage Histogram to analyze the percentage of the wall time the specific number of CPUs were running simultaneously.
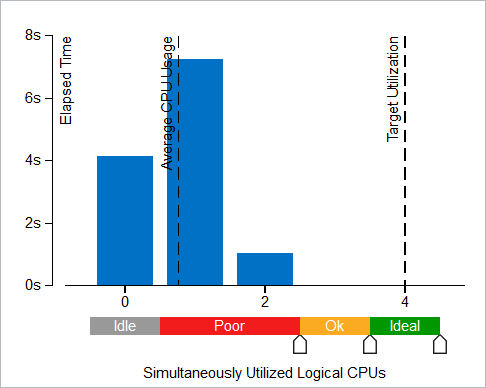
| Use This | To Do This |
|---|---|
Vertical bars |
Hover over the bar to identify the amount of Elapsed time the application spent using the specified number of logical CPUs. |
Target Utilization |
Identify the target CPU usage. This number is equal to the number of logical CPUs. Consider this number as your optimization goal. |
Average CPU Usage |
Identify the average number of CPUs used aggregating the entire run. It is calculated as CPU time / Elapsed time. CPU usage at any point in time cannot surpass the available number of logical CPUs. Even when the system is oversubscribed, and there are more threads running then CPUs, the CPU usage is the same as the number of CPUs. Use this number as a baseline for your performance measurements. The closer this number to the number of logical CPUs, the better, except for the case when the CPU time goes to spinning. |
Utilization Indicator bar |
Analyze how the various utilization levels map to the number of simultaneously utilized logical CPUs. NoteIn the CPU Usage histogram, the VTune Amplifier treats the Spin and Overhead time as Idle CPU usage. Different analysis types may recognize Spin and Overhead time differently depending on availability of call stack information. This may result in a difference of CPU Usage graphical representation per analysis type. |
Frame Rate Histogram
If you used the Frame API to mark the start and finish of the code regions executed repeatedly (frames) in your graphics application, the VTune Amplifier analyzes this data and helps you identify regions that ran slowly. Explore the Frame Rate Histogram section and identify slow and fast frame domains.
Use This |
To Do This |
|---|---|
Domain drop-down menu |
Choose a frame domain to analyze with the frame rate histogram. If only one domain is available, the drop-down menu is grayed out. Then, you can switch to the Bottom-up window grouped by Frame Domain, filter the data by slow frames and switch to the Function grouping to identify functions in the slow frame domains. Try to optimize your code to keep the frame rate constant (for example, from 30 to 60 frames per second). |
Vertical bars |
Hover over a bar to see the total number of frames in your application executed with a specific frame rate. High number of slow or fast frames signals a performance bottleneck. |
Frame rate bar |
Use the sliders to adjust the frame rate threshold (in frames per second) for the currently open result and all subsequent results in the project. |
OpenMP Analysis Collection Time
This section displays the Collection Time as well as metrics for the duration of serial (outside parallel regions) and parallel portions of the program. If the Serial time is significant, review the Top Serial Hotspots section and consider options to minimize serial execution, either by introducing more parallelism or by doing algorithm or microarchitecture tuning for sections that seem unavoidably serial. For high thread-count machines, serial sections have a severe negative impact on potential scaling (Amdahl's Law) and should be minimized as much as possible.
Top OpenMP Regions by Potential Gain
To estimate the efficiency of CPU utilization in the parallel part of the code, use the Potential Gain metric. This metric estimates the difference in the Elapsed time between the actual measurement and an idealized execution of parallel regions, assuming perfectly balanced threads and zero overhead of the OpenMP runtime on work arrangement. Use this data to understand the maximum time that you may save by improving parallel execution.
The Summary window provides a detailed table listing the top five parallel regions with the highest Potential Gain metric values. For each parallel region defined by the pragma #omp parallel, this metric is a sum of potential gains of all instances of the parallel region.
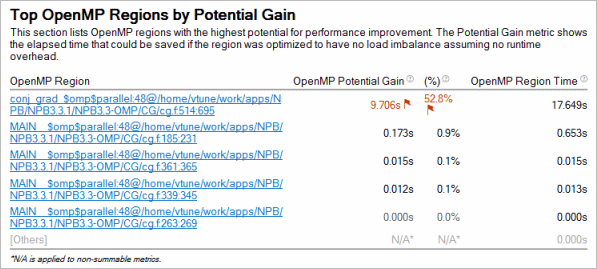
If Potential Gain for a region is significant, you can go deeper and select the link on a region name to navigate to the Bottom-up window employing the /OpenMP Region/OpenMP Barrier-to-Barrier Segment/.. dominant grouping that provides detailed analysis of inefficiency metrics like Imbalance by barriers.
Clicking the process name links leads you to the Bottom-up window grouped by /Process/OpenMP Region/.. where you can get more details on OpenMP inefficiencies for MPI ranks.
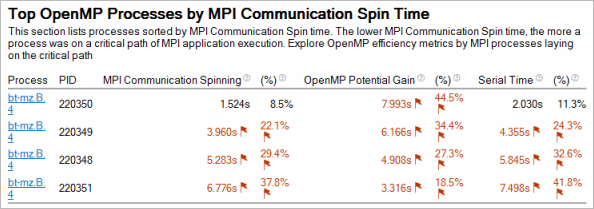
Top OpenMP processes by MPI Communication Spin Time
For MPI analysis result including more than one process with OpenMP regions, the Summary window shows a section with top processes laying on a critical path of MPI execution with Serial Time and OpenMP Potential Gain aggregated per process:
OpenMP Region CPU Usage Histogram
Use This |
To Do This |
|---|---|
OpenMP Region drop-down menu |
Filter the histogram data by the selected OpenMP region. Start your OpenMP analysis from the top of the list that is sorted by the Potential Gain metric value, which is the maximum elapsed time that could be saved if the OpenMP region is optimized to have no load imbalance assuming no runtime overhead (Collection Time minus Ideal Time). |
Vertical bars |
Hover over a bar to see how much time the specific number of CPUs were running simultaneously in the OpenMP region selected from the OpenMP Region drop-down menu. Spin and Overhead time adds to the Idle CPU usage value. |
Target Concurrency |
Identify the target concurrency level. This number is equal to the number of logical CPUs. Consider this number as your optimization goal. |
Average |
Identify the average number of CPUs used aggregating the entire run. It is calculated as CPU time / Elapsed time. Use this number as a baseline for your performance measurements. The closer this number to the number of logical CPUs (Target Concurrency), the better, except for the case when the CPU time goes to spinning. |
Utilization Indicator bar |
Analyze how the various utilization levels map to the number of simultaneously running CPUs. |
OpenMP Region Duration Histograms
Use This |
To Do This |
|---|---|
OpenMP Region drop-down menu |
Choose an OpenMP region to see the number of instances distributed by duration. |
Instance Count |
Hover over a bar to see the total number of OpenMP region instances in your application executed with a specific duration. High number of slow or fast regions signals a performance bottleneck. |
Duration Type (sec) |
Use the sliders to adjust the duration threshold (in seconds) for the currently open result. Initial distribution of region instances by Fast/Good/Slow categories is done as a ratio of 20/40/20 between min and max region time values. |
Collection and Platform Info
This section provides the following data:
Application Command Line |
Path to the target application. |
Operating System |
Operating system used for the collection. |
Computer Name |
Name of the computer used for the collection. |
Result Size |
Size of the result collected by the VTune Amplifier. |
Collection start time |
Start time (in UTC format) of the external collection. Explore the Timeline pane to track the performance statistics provided by the custom collector over time. |
Collection stop time |
Stop time (in UTC format) of the external collection. Explore the Timeline pane to track the performance statistics provided by the custom collector over time. |
Collector type |
Type of the data collector used for the analysis. The following types are possible:
|
CPU Information |
|
Name |
Name of the processor used for the collection. |
Frequency |
Frequency of the processor used for the collection. |
Logical CPU Count |
Logical CPU count for the machine used for the collection. |
Physical Core Count |
Number of physical cores on the system. |
User Name |
User launching the data collection. This field is available if you enabled the per-user event-based sampling collection mode during the product installation. |
GPU Information |
|
Name |
Name of the Graphics installed on the system. |
Vendor |
GPU vendor. |
Driver |
Version of the graphics driver installed on the system. |
Stepping |
Microprocessor version. |
EU Count |
Number of execution units (EUs) in the Render and GPGPU engine. This data is Intel® HD Graphics and Intel® Iris® Graphics (further: Intel Graphics) specific. |
Max EU Thread Count |
Maximum number of threads per execution unit. This data is Intel Graphics specific. |
Max Core Frequency |
Maximum frequency of the Graphics processor. This data is Intel Graphics specific. |
Graphics Performance Analysis |
GPU metrics collection is enabled on the hardware level. This data is Intel Graphics specific. NoteSome systems disable collection of extended metrics such as L3 misses, memory accesses, sampler busyness, SLM accesses, and others in the BIOS. On some systems you can set a BIOS option to enable this collection. The presence or absence of the option and its name are BIOS vendor specific. Look for the Intel® Graphics Performance Analyzers option (or similar) in your BIOS and set it to Enabled. |