Use the Summary window as your starting point of the performance analysis with the Intel® VTune™ Amplifier. To access this window, select the TSX Explorationviewpoint and click the Summary sub-tab in the result tab.
The TSX Exploration viewpoint is enabled for TSX Exploration and TSX Hotspots analysis results and targeted for Intel® processors supporting Intel Transactional Synchronization Extensions (Intel TSX). Depending on the analysis type, the Summary window provides the following application-level statistics in the TSX Exploration viewpoint:
Note
You may click the
 Copy to Clipboard button to copy the content of the selected
summary section to the clipboard.
Copy to Clipboard button to copy the content of the selected
summary section to the clipboard.
Analysis Metrics
For the transactional success analysis, the VTune Amplifier provides the following metrics:
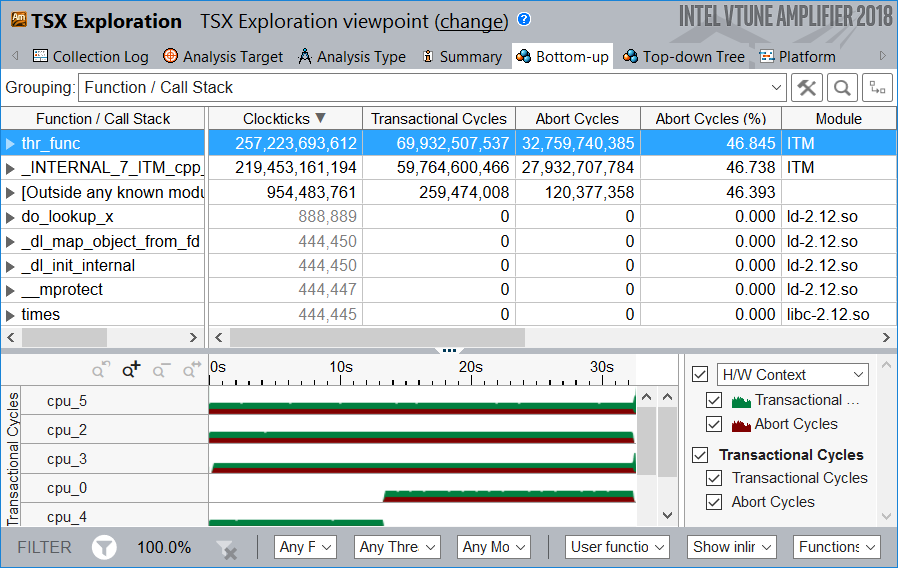
Clockticks to measure the total number of collected unhalted cycles.
Transactional Cycles to measure the number of cycles spent during transactions. If it is near zero then the application is either not using lock-based synchronization or not using a synchronization library enabled for lock elision through the Intel TSX instructions.
Abort Cycles to measure the number of cycles spent during transactions which were eventually aborted. If it is small relative to Transactional Cycles, then the transactional success rate is high and additional tuning is not required. If it is almost the same as Transactional Cycles (but not very small), then most transactional regions are aborting and lock elision is not going to be beneficial. To identify the causes for transactional aborts and reduce them, enable the Aborts analysis.
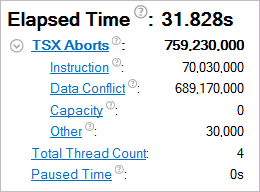
VTune Amplifier classifies aborts by the following reasons:
Instruction: Some instructions, such as CPUID and IO instructions, may cause a transactional execution to abort in the implementation.
Data Conflict: A conflicting data access occurs if another logical processor either reads a location that is part of the transactional region's write-set or writes a location that is a part of either the read- or write-set of the transactional region. Since Intel TSX detects data conflicts at the granularity of a cache line, unrelated data locations placed in the same cache line will be detected as conflicts.
Capacity: Transactional aborts may occur due to limited transactional resources. For example, the amount of data accessed in the region may exceed an implementation-specific capacity.
In the example below, most of the transactional executions were aborted due to a data conflict:
Switch to the Bottom-up window to analyze the Data Conflict statistics per function.
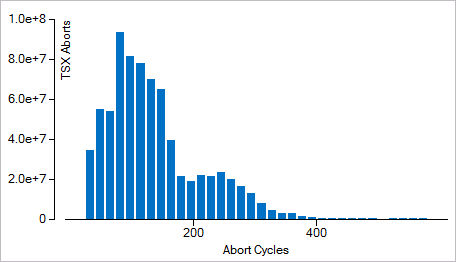
Abort Cycles Histogram
This histogram shows the number of aborts happened for transactions with a specific cycles duration.
Collection and Platform Info
This section provides the following data:
Application Command Line |
Path to the target application. |
Operating System |
Operating system used for the collection. |
Computer Name |
Name of the computer used for the collection. |
Result Size |
Size of the result collected by the VTune Amplifier. |
Collection start time |
Start time (in UTC format) of the external collection. Explore the Timeline pane to track the performance statistics provided by the custom collector over time. |
Collection stop time |
Stop time (in UTC format) of the external collection. Explore the Timeline pane to track the performance statistics provided by the custom collector over time. |
Collector type |
Type of the data collector used for the analysis. The following types are possible:
|
CPU Information |
|
Name |
Name of the processor used for the collection. |
Frequency |
Frequency of the processor used for the collection. |
Logical CPU Count |
Logical CPU count for the machine used for the collection. |
Physical Core Count |
Number of physical cores on the system. |
User Name |
User launching the data collection. This field is available if you enabled the per-user event-based sampling collection mode during the product installation. |
GPU Information |
|
Name |
Name of the Graphics installed on the system. |
Vendor |
GPU vendor. |
Driver |
Version of the graphics driver installed on the system. |
Stepping |
Microprocessor version. |
EU Count |
Number of execution units (EUs) in the Render and GPGPU engine. This data is Intel® HD Graphics and Intel® Iris® Graphics (further: Intel Graphics) specific. |
Max EU Thread Count |
Maximum number of threads per execution unit. This data is Intel Graphics specific. |
Max Core Frequency |
Maximum frequency of the Graphics processor. This data is Intel Graphics specific. |
Graphics Performance Analysis |
GPU metrics collection is enabled on the hardware level. This data is Intel Graphics specific. NoteSome systems disable collection of extended metrics such as L3 misses, memory accesses, sampler busyness, SLM accesses, and others in the BIOS. On some systems you can set a BIOS option to enable this collection. The presence or absence of the option and its name are BIOS vendor specific. Look for the Intel® Graphics Performance Analyzers option (or similar) in your BIOS and set it to Enabled. |