Use the Summary window as your starting point of the performance analysis with the Intel® VTune™ Amplifier. To access this window, click the Summary sub-tab in the result tab.
Use the Elapsed Time metric as your primary indicator and a baseline for comparison of results before and after optimization. Note that for multithreaded applications, the CPU Time is different from the Elapsed Time since the CPU Time is the sum of CPU time for all application threads.
In the Summary window of the GPU Hotspots viewpoint, the VTune Amplifier introduces the following analysis workflow:
Analyze the GPU Usage section to identify whether the GPU was properly utilized.
For compute-bound applications, focus on the EU Array Stalled/Idle section and explore the most typical reasons of the EU waits.
For FPU bound applications, focus on the FPU Utilization section and identify kernels overutilizing both FPUs.
For memory-bound applications, focus on the Memory Info section.
Note
You may click the
 Copy to Clipboard button to copy the content of the selected summary section to the clipboard.
GPU Usage
The GPU Usage metric in the Summary window shows the maximum GPU usage across all engines that had at least one DMA packet executed. By default, the VTune Amplifier flags the GPU usage less than 80% as a performance issue. In the example below, only 24.3% of the application elapsed time was utilized by GPU engines.
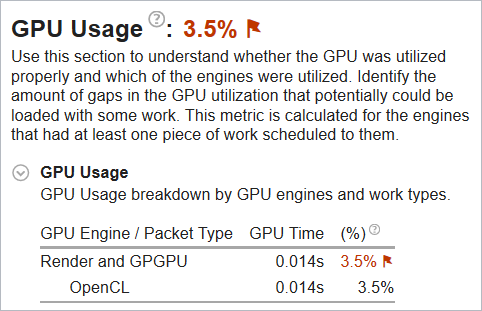
Depending on the target platform used for GPU analysis, the GPU Usage section shows the time (in seconds) used by GPU engines. Note that GPU engines may work in parallel and the total time taken by GPU engines does not necessarily equal the application Elapsed time.
You may correlate GPU Time data with the Elapsed Time metric. The percent value next to the GPU Time shows a share of the Elapsed time used by a particular GPU engine. If the GPU Time takes a significant portion of the Elapsed Time, it clearly indicates that the application is GPU-bound.
The Summary view provides the Packet Queue Depth Histogram that helps you estimate the GPU software queue depth per GPU engine during the target run:
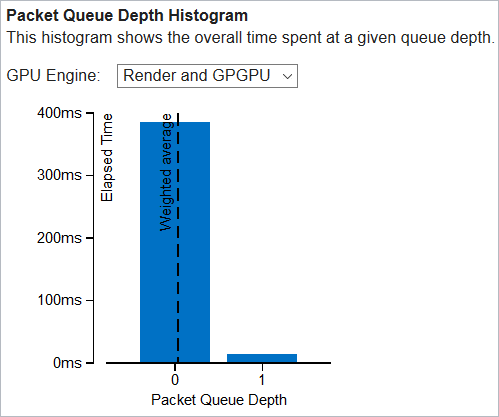
Ideally, your goal is an effective GPU engine utilization with evenly loaded queues and minimal duration for the zero queue depth.
For a high-level view of the DMA packet execution during the target run, review the Packet Duration Histogram:
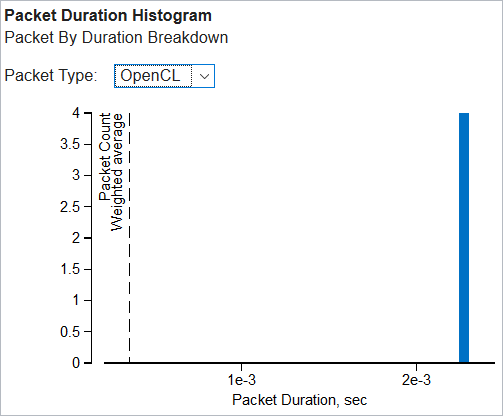
Select a required packet type from the drop-down menu and identify how effectively these packets were executed on the GPU. Having high Packet Count values for the minimal duration is optimal.
To get detailed information on the packet queues and execution, switch to the Platform tab and analyze the GPU software queue on the timeline.
For OpenCL™ applications, explore the Hottest GPU Computing Tasks section that helps you understand which OpenCL kernels had performance issues:
Mouse over a flagged computing task for details on a performance issue. For example, for the transpose computing task a significant portion of the GPU time was spent in stalls, which may result from frequent sampler or memory accesses. You may click a hot GPU computing task to open the Graphics window with this computing task pre-selected for your convenience.
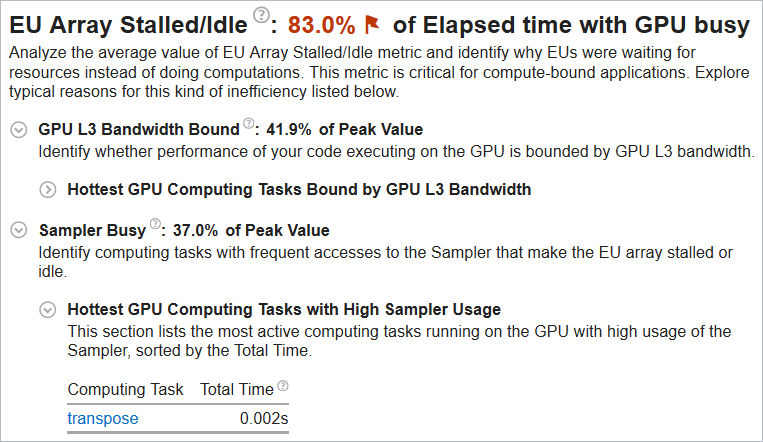
EU Array Stalled/Idle
For further analysis of the compute-bound workloads, explore the EU Array Stalled/Idle section that shows the most typical reasons why the execution units could be waiting. This section shows up for the analysis that collects Intel® HD Graphics and Intel® Iris™ Graphics hardware events, for example, for the GPU Hotspots.
Depending on the events preset you used for the configuration, the VTune Amplifier analyzes metrics for stalled/idle executions units. The GPU Hotspots analysis by default collects the Overview preset including the metrics that track general GPU memory accesses, such as Sampler Busy and Sampler Is Bottleneck, and GPU L3 bandwidth. As a result, the EU Array Stalled/Idle section displays the Sampler Busy section with a list of GPU computing tasks with frequent access to the Sampler and hottest GPU computing tasks bound by GPU L3 bandwidth:
If you select the Compute Basic preset during the analysis configuration, the VTune Amplifier analyzes metrics that distinguish accessing different types of data on a GPU and displays the Occupancy section that helps you identify GPU tasks with low occupancy:
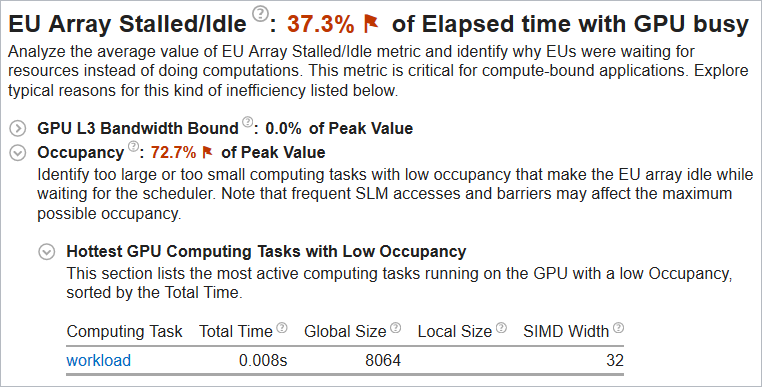
If the occupancy is flagged as a problem for your application, consider changing the size of computing tasks since too large or too small tasks typically make the EU array idle.
The Compute Basic preset also enables an analysis of the DRAM bandwidth usage. If the GPU workload is DRAM bandwidth-bound, the corresponding metric value is flagged. You can explore the table with GPU computing tasks heavily using the DRAM bandwidth during execution.
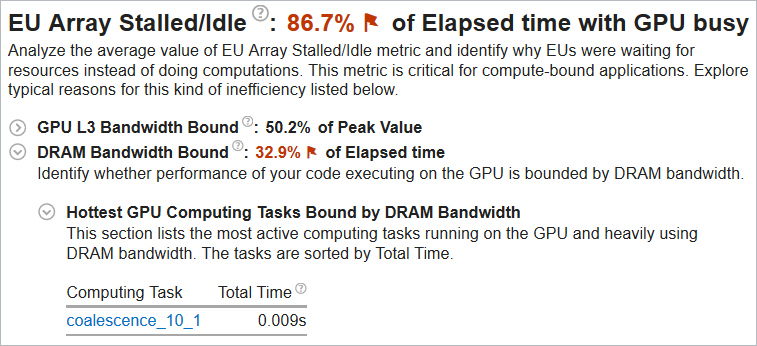
In the example above, the workload spent 32.9% of its Elapsed time using the DRAM bandwidth, which is considered a performance issue for this system. In this case the VTune Amplifier recommends focusing on the computing tasks specified in the table (coalescense_10_1 in this example) improving data accesses to reduce cacheline transfers from/to memory using such possible techniques: 1) consume all bytes of each cacheline before it is evicted; 2) merge compute-limited and bandwidth-limited loops.
If you select the Full Compute preset and multiple run mode during the analysis configuration, the VTune Amplifier will use both Overview and Compute Basic event groups for data collection and provide all types of reasons for the EU array stalled/idle issues in the same view.
Note
To analyze Intel® HD Graphics and Intel® Iris® Graphics hardware events on Linux targets, make sure to install the Intel Media Server Studio (starting with version 2015 R5) and build the kernel driver as described in the Intel Media Server Studio Getting Started Guide.
FPU Utilization
If your application execution takes more than 80% of collection time heavily utilizing both floating point units (FPUs), the VTune Amplifier highlights such a value as an issue and lists the kernels that overutilized the FPUs:
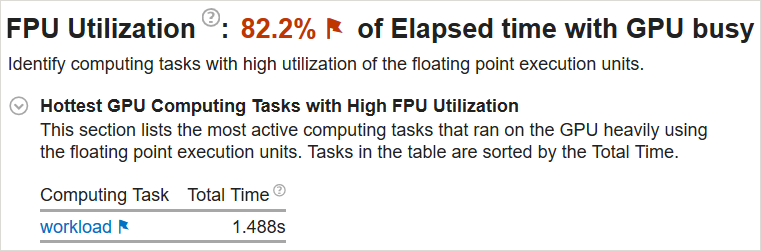
Click a flagged kernel to switch to the Graphics tab > Timeline pane, explore the distribution of the GPU EU Instructions metric that shows the FPU usage during the analysis run, and identify time ranges with the highest metric values. To address high FPU utilization issue for your code, consider reducing computations.
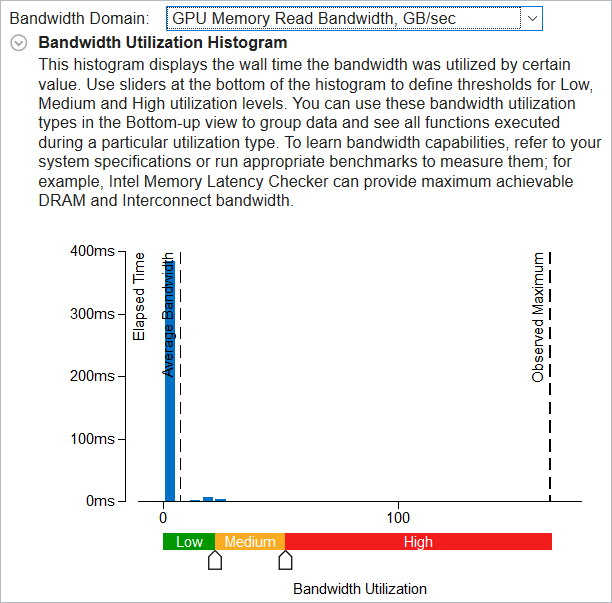
Memory Info
For memory-bound applications, explore the Memory Info section that includes statistics on the average system bandwidth and a Bandwidth Utilization histogram that shows how intensively your application was using each bandwidth domain:
Collection and Platform Info
Explore the platform information including GPU and CPU data. The last four GPU characteristics are specific to Intel® HD Graphics and Intel® Iris® Graphics.