外部のコレクターで収集されたパフォーマンス・データを、CSV 形式でインテル® VTune™ Amplifier にインポートして調査します。
間隔データをインポートする例:
個別のデータをインポートする例:
間隔データをインポートする例
例 1: パフォーマンス・カウンター・タイムスタンプの CSV ファイル
name,start_tsc.QPC,end_tsc,pid,tid
frame1,2,30,,
frame1,33,59,,
taskType1,3,43,1,1
taskType2,5,33,1,1
taskType1,46,59,1,1
taskType2,45,54,1,1
インテル® VTune™ Amplifier は、PID と TID がないデータをフレームとして処理し、PID と TID があるデータをタスクとして処理します。
例 2: システム・カウンター・タイムスタンプの CSV ファイル
name,start_tsc.UTC,end_tsc,pid,tid
Frame1,2013-08-28 01:02:03.0004,2013-08-28 01:02:03.0005,,
Task,2013-08-28 01:02:03.0004,2013-08-28 01:02:03.0005,1234,1235
例 3: プロセスに紐付けられた間隔データの CSV ファイル
name,start_tsc.TSC,end_tsc,pid,tid
function1_task_type,419280823342846,419280876920231,12832,11644
function2_task_type,419280876920231,419281044717992,12832,11644
function1_task_type,419281044745822,419281102121452,12832,11644
function2_task_type,419281102121452,419281277898762,12832,11644
function1_task_type,419281277935812,419281342158661,12832,11644
function2_task_type,419281342158661,419281527040239,12832,11644
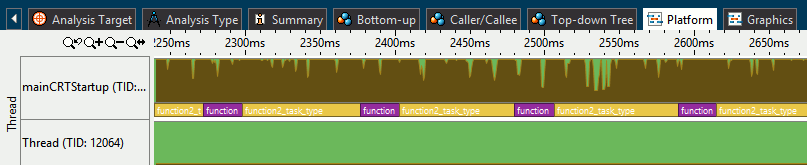
インテル® VTune™ Amplifier は、このデータをタスク (TID と PID 値がある) として処理し、次のように結果を [Platform (プラットフォーム)] ウィンドウに表示します。
例 4: インポートされたプロセスに紐付けられた間隔データをレポートするコマンドライン
この例では、hotspots レポートは、特定のプロセス/スレッドに関連付けられたカウンターをタスクでグループ化して表示しています。
amplxe-cl -R hotspots -group-by=task -r my_result
amplxe: Using result path 'my_result'
amplxe: Executing actions 50 % Generating a report
Task Type           CPU Time:Self  Task Time:Self  Overhead Time:Self  Spin Time:Self  Thread Counter:victim_counter:Self  Thread Counter:victim_counter_x2:Self
------------------  -------------  --------------  ------------------  --------------  ---------------------------         ---------------------------------
[Outside any task]              0               0                   0               0                            0         2
ITT Task                        0           0.009                   0               0                            2         6
victim_task                     0           0.000                   0               0                            0         0
amplxe: Executing actions 100 % done
例 5: 特定のプロセスに依存しない間隔データ
name,start_tsc.TSC,end_tsc,pid,tid
calibrating_frame,419743756747826,419747241283878,,
open_file_frame,419747251423510,419747504506086,,
インテル® VTune™ Amplifier は、このデータをフレーム (TID と PID 値がない) として処理し、次のように結果を表示します。
インテル® VTune™ Amplifier を使用すると、[Timeline (タイムライン)] ペインとグリッド表示のフレームデータを容易に対応付けることができます。
例 6: インポートされたプロセスに紐付けられていない間隔データをレポートするコマンドライン
この例では、hotspots レポートは、特定のプロセス/スレッドに関連付けられていないカウンターをフレームでグループ化して表示しています。
amplxe-cl -R hotspots -group-by=frame-domain -r my_result
amplxe: Using result path 'my_result'
amplxe: Executing actions 50 % Generating a report
Frame Domain     Frame Time:Self  Counter:global_counter:Self  Counter:global_counter_x2:Self
------------     ---------------  ---------------------------  -----------------------------
cuscol_frame     0.126            4                            8
cuscol_utc_frame 0.126            4                            8
amplxe: Executing actions 100 % done
個別のデータをインポートする例
例 1: パフォーマンス・カウンター・タイムスタンプの CSV ファイル
tsc.QPC,MyCounter1.COUNT,MyCounter2.INST,pid,tid
2,1,3,1,1
5,2,5,1,1
10,3,3,1,1
23,10,7,1,1
例 2: システム・カウンター・タイムスタンプの CSV ファイル
tsc.UTC,MyCounter1.COUNT,MyCounter2.COUNT,pid,tid
2013-08-28 01:02:03.0004,1234,,1234,1235
2013-08-28 01:02:03.0005,1234,,1234,1235
 2013-08-28 01:02:03.0006,,1000234,,
例 3: 特定のプロセスに依存しない個別データの CSV ファイル
tsc.TSC,global_inst_val1.INST,global_counterWIV.COUNT,pid,tid
78912463824135,3,6,,
78916553573577,6,9,,
78919519641325,3,12,,
78922574591880,6,18,,
78925599513489,3,21,,
インテル® VTune™ Amplifier はこのデータ処理して次にように結果を表示します。
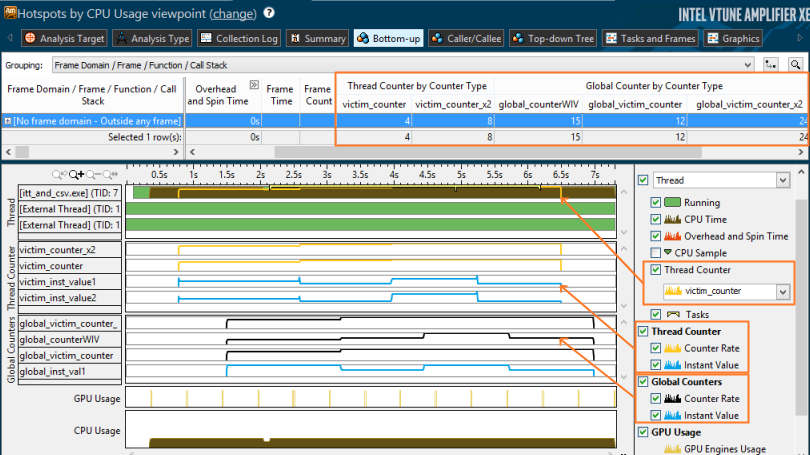
個別の累積されたカウンター値 (スレッド固有とグローバル (非スレッド固有) の両方) は、グリッド表示と [Timeline] ペイン (黄色) に表示されます。その瞬間のカウンター値 (スレッド固有とグローバル) は、[Timeline] ペインにのみに青色で表示されます。
注
グリッドのグローバルなカウンター値を表示するには、[Frame Domain/Frame/Function/Call Stack (フレームドメイン/フレーム/関数/コールスタック)] などの (スレッド固有ではない) 汎用のグループ化レベルが選択します。
例 4: インポートされた個別データをレポートするコマンドライン
この例では、外部の個別データ (カウンター) をインテル® VTune™ Amplifier のハードウェア・イベントベース・サンプリング解析結果 cl_result.amplxe と統合した hw-events レポートを示しています。
amplxe-cl -R hw-events -group-by=process -r my_result
amplxe: Using result path 'my_result'
amplxe: Executing actions 50 % Generating a report
Process          Counter:victim_counter:Self  Counter:victim_counter_x2:Self
---------------  ---------------------------  ------------------------------
itt_and_csv.exe                            2                               4
amplxe: Executing actions 100 % done