Use the Bottom-up window in the Memory Usage viewpoint to identify code sections and memory objects with NUMA issues and high bandwidth utilization.
To access this window: Select the Memory Usage viewpoint and click the Bottom-up tab. For this viewpoint, the Bottom-up window includes the following panes:
|
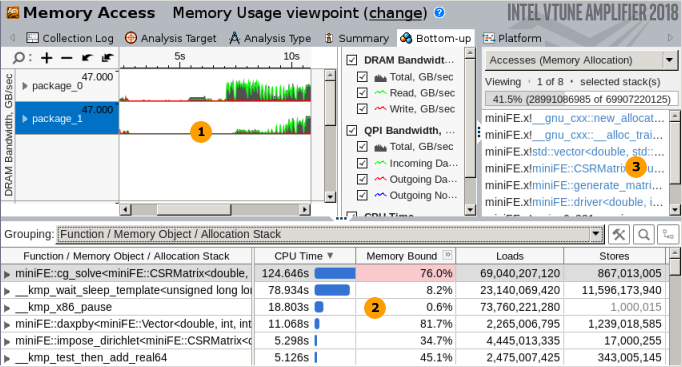
Timeline pane. This pane helps identify bandwidth issues in your application over time. For Memory Analysis results, the DRAM Bandwidth graph is scaled according to the maximum achievable DRAM bandwidth measured by the VTune Amplifier before the collection start. To enable this functionality for custom analysis results, make sure to select the Evaluate max DRAM bandwidth option. If this option is not enabled, the thresholds are calculated based on the maximum bandwidth value collected for this result. Bandwidth events are not associated with any core, but, instead, associated with the uncore (iMC, the integrated memory controller). Uncore events happen on structures shared between all CPUs in a package (for example, 10 CPUs on a single package). This makes it impossible to associate any single uncore event with any code context. So, the VTune Amplifier may only associate bandwidth uncore event counts with the socket, or package, on which the uncore event happened, and time. Hover over a bar with high bandwidth value to learn how much data was read from or written to DRAM through the on-chip memory controller. Use time-filtering context menu options to filter in a specific range of time during which bandwidth is notable. Then, switch to the core-based events that correlate with bandwidth in the grid below to determine what specific code is inducing all the bandwidth. |
|
Grid pane. Each row in the grid corresponds to a grouping level (granularity) of program units (module, function, memory object, and others). By default, the grid data in the Memory Usage viewpoint is grouped by Function/Memory Object/Allocation Stack (if memory objects collection is enabled) or Function/Call Stack (if memory objects collection is disabled). To identify memory objects/functions inducing high bandwidth, switch to the Bandwidth Domain/Bandwidth Utilization Type/Memory Object/Allocation Stack (or Bandwidth Domain/Bandwidth Utilization Type/Function/Call Stack if dynamic objects are not analyzed) grouping, expand a bandwidth domain in the grid and focus on the memory objects/functions listed under the High utilization type. NoteMemory objects identification is supported only for Linux targets and only for processors based on Intel microarchitecture code name Sandy Bridge and later. On Windows you can group by Cachelines, see the metrics against the code, and figure out what data structures it accesses. There are several types of memory objects:
Each data column in the grid corresponds to a performance metric. By default, all program units are sorted in the descending order by metric values in the fist column providing the most performance-critical program units first. You may click a column header to sort the table by the required metric. For example, to identify which memory objects/functions were frequently accessed when the bandwidth utilization was high, sort the grid by the LLC Miss Count metric. The list of performance metrics varies depending on the analysis configuration. Mouse over a column header (metric) to read the metric description and formula used for its calculation (if available), or right-click and select the What's This Column? option from the context menu. If a metric has a threshold value set up by the VTune Amplifier architect and this value is exceeded, the VTune Amplifier highlights such a value in pink. You may mouse over a pink cell to read the description of the detected issue, tuning advice, and view a formula used to calculate the threshold for this metric. Grayed out metric values in the grid indicate that the data collected for such a metric is unreliable. This may happen, for example, if the number of samples collected for PMU events is too low. In this case, when you hover over such an unreliable metric value, the VTune Amplifier displays a message: The amount of collected PMU samples is too low to reliably calculate the metric. To manage grid data, use the toolbar options:
|
|
Call Stack pane. For Memory Access analysis, you may use the Accesses (Memory Allocation) menu option to view call stacks allocating a memory object selected in the grid and identify the contribution of each stack to the number of accesses (loads and stores) to this object. In the example above, the new_allocator.h:104 object selected in the grid was accessed in a single stack 1325671222 times. |


 Customize Grouping button to open the
 Find button to open a search bar and search for a string in the grid.
 Change Stack Layout button to switch between call stack layouts.
