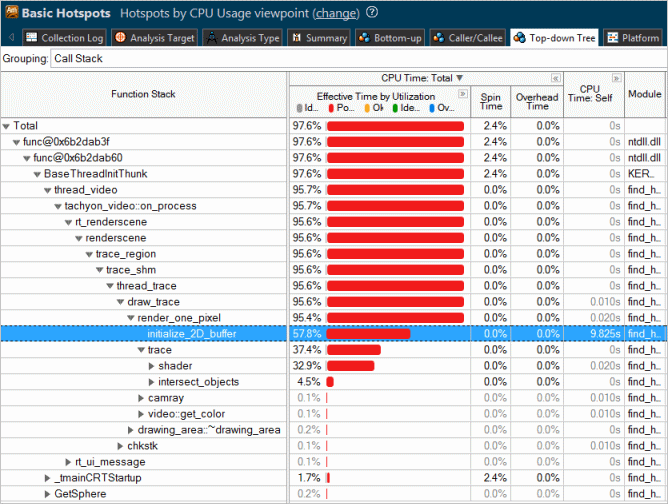
Use the Top-down Tree window to explore the call sequence flow of the application and analyze the time spent in each program unit and on its callees.
To access this pane: Run a performance analysis type collecting stacks and click the Top-down Tree tab when the collection result opens.

Function Stack |
The Function Stack column represents call sequences (stacks) detected during collection phase starting from the application root (usually, the main() function). The time value for a row is equal to the sum of all the nested items from that row. Use this data to see the impact of program units together with their callees. This type of investigation is known as a top-down analysis. In this example above, the initialize_2D_buffer function is the biggest hotspot of the application. It shows up in one stack and does not have any callees. Its caller function, render_one_pixel, has four callees where initialize_2D_buffer and trace functions are the first candidates for optimization. The call stacks are always available for the results of the user-mode sampling and tracing collection. They are also available for the results of the hardware event-based sampling collection, if you enabled the Collect stacks option during the analysis configuration. Otherwise, the Function Stack column for the event-based sampling results shows a flat list of the functions. |
<Performance metrics> |
Each data column in the Top-Down Tree grid corresponds to a performance metric. The list of performance metrics varies with the analysis type and selected viewpoint. In the Top-down Tree window, the Intel® VTune™ Amplifier provides two types of metrics:
By default, all program units are sorted in a descending order by the metric values in the first column (for example, CPU Time: Total) providing the most performance-critical program units first. You may click a column header to re-sort the table by the required metric. NoteMouse over a column header to see a metric description and a formula used for metric calculation (if available). |