User task and API data can be visualized in Intel® VTune™ Amplifier performance analysis results.
After you have added basic annotations to your application to control performance data collection, you can view these annotations in the Intel VTune Amplifier timeline. All supported instrumentation and tracing technology (ITT) API tasks can be visualized in VTune Amplifier.
Use the following steps to include ITT API tasks in your performance analysis collection:
- Click the
 New Analysis toolbar button to begin a new collection.
- Set up the Analysis Target. For more information, see Analysis Target Setup.
- Switch to the Analysis Type tab by clicking the Choose Analysis button or selecting the tab at the top of the window.
- Select an analysis type. For more information about each analysis type, see Performance Analysis Setup.
Select the Analyze user tasks, events, and counters checkbox to view the API tasks, counters, and events that you added to your application code.
Note
In some cases, the Analyze user tasks, events, and counters checkbox is in the expandable Details section. To enable the checkbox, use the Copy button at the top of the tab to create an editable version of the analysis type configuration. For more information, see Custom Analysis and Custom Analysis - New Hardware Event-based Sampling Analysis.
- Click the Start button.
After collection completes, the analysis results appear in a viewpoint specific to the analysis type selected. The API data collected is available in the following locations:
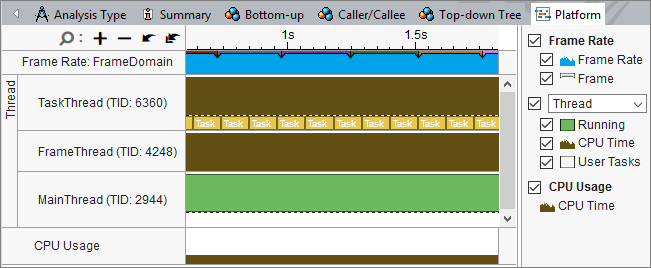
Timeline view: Each API type appears differently on the timeline view. In the example below, the code was instrumented with the task API, frame API, event API, and collection control API. Tasks appear as yellow bars on the task thread. Frames appear at the top of the timeline in pink. Events appear on the appropriate thread as a triangle at the event time. Collection control events span the entire timeline. Hover over a task, frame, or event to view the type of API task.
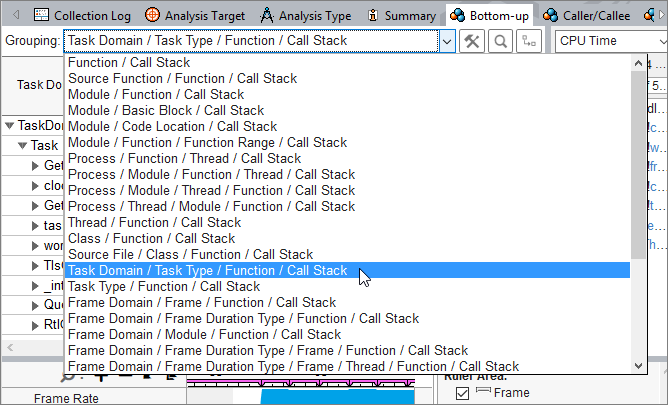
Grid view: Set the Grouping to Task Domain / Task Type / Function / Call Stack or Task Type / Function / Call Stack to view task data in the grid pane.
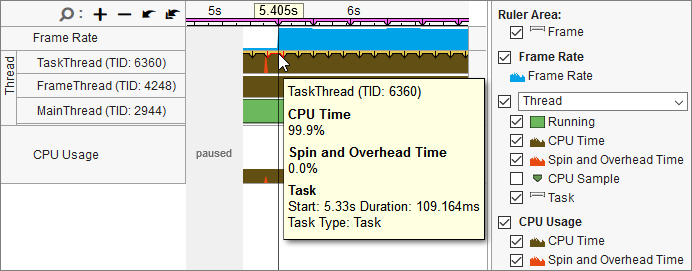
Platform tab: Individual tasks are available in a larger view on the Platform tab. Hover over a task to get more information.