
この記事は、インテル® デベロッパー・ゾーンに公開されている「How to display loops info as hot functions in command line in Intel® VTune™ Amplifier XE’s report」(https://software.intel.com/en-us/blogs/2016/05/04/how-to-display-loops-info-as-hot-functions-in-command-line-in-intel-vtune-amplifier-xes-report) の日本語参考訳です。
インテル® VTune™ Amplifier XE には、アプリケーションのコールツリーでループを階層表示し、最適化の可能性があるコード領域を特定するオプションがあります。以下は、”-knob collection-detail=stack-call-and-tripcount” オプションを使用してデータを収集した結果です。
# amplxe-cl -c advanced-hotspots -knob collection-detail=stack-call-and-tripcount -r r001ah — ./matrix
# amplxe-cl -R hotspots -r r001ah -group-by function,callstack -column ‘Total Iteration Count’
amplxe: Using result path `/home/peter/problem_report/r001ah’
amplxe: Executing actions 75 % Generating a report Column filter is ON.
Function/Function Stack Total Iteration Count
———————————— ——————————
multiply 1,075,237,174
multiply 1,075,237,174
main 1,066,694,757
__libc_start_main 1,066,694,757
_start 1,066,694,757
multiply 8,542,417
main 8,542,417
__libc_start_main 8,542,417
_start 8,542,417
……
このレポートにはループに関する情報が含まれていません。インテル® VTune™ Amplifier XE のスタンドアロン GUI を起動して、”amplxe-gui r001ah” の結果を表示し、レポートの下にある [Filter] パネルで [Loop only] または [Loops and functions] を選択する必要があります。
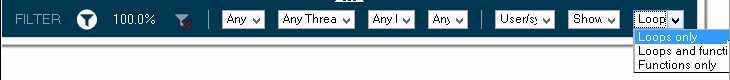
そうすると、次のような結果が表示されます。
# amplxe-cl -R hotspots -r r001ah -group-by function,callstack -column ‘Total Iteration Count’
amplxe: Using result path `/home/peter/problem_report/r001ah’
amplxe: Executing actions 75 % Generating a report Column filter is ON.
Function/Function Stack Total Iteration Count
——————————————— ——————————-
[Loop at line 19 in multiply] 1,074,181,542
[Loop at line 19 in multiply] 1,074,181,542
[Loop at line 14 in multiply] 1,074,181,542
[Loop at line 13 in multiply] 1,074,181,542
multiply 1,074,181,542
main 1,065,647,177
……
しかし、インテル® VTune™ Amplifier XE のスタンドアロン GUI を開いて、結果の状態を変更しなければならないのは不便です。データ収集時に “-loop-mode=loop-only | loop-and-function” オプションを使用すると、結果の状態を設定できます (そのため、amplxe-gui を使用して状態を変更する必要がありません)。
# amplxe-cl -c advanced-hotspots -loop-mode=loop-and-function -knob collection-detail=stack-call-and-tripcount -r r002ah — ./matrix
これにより、必要な結果を素早く確認できます。
# amplxe-cl -R hotspots -r r002ah -group-by function,callstack -column ‘Total Iteration Count’
amplxe: Using result path `/home/peter/problem_report/r002ah’
amplxe: Executing actions 75 % Generating a report Column filter is ON.
Function/Function Stack Total Iteration Count
————————————————— ———————
[Loop at line 19 in multiply] 1,074,255,875
[Loop at line 19 in multiply] 1,074,255,875
[Loop at line 14 in multiply] 1,074,255,875
[Loop at line 13 in multiply] 1,074,255,875
multiply 1,074,255,875
main 1,066,516,154
[Loop@0x3d0c61eca9 in __libc_start_main] 1,066,516,154
__libc_start_main 1,066,516,154
_start 1,066,516,154
……
コンパイラーの最適化に関する詳細は、最適化に関する注意事項を参照してください。